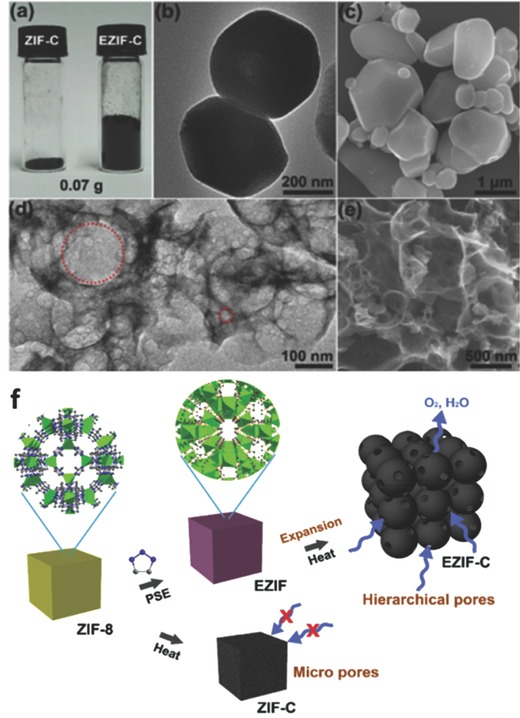
Figure 2.

a) Photograph of ZIF‐C and EZIF‐C with the same weight. b) TEM and c) SEM images of ZIF‐C; d) TEM and e) SEM images of EZIF‐C; f) The large and small red circles in (d) indicated the macropore and mesopore, respectively. The illustration for the formation of the hierarchically porous carbon from ZIF‐8. Reproduced with permission.93 Copyright 2017, Elsevier.
