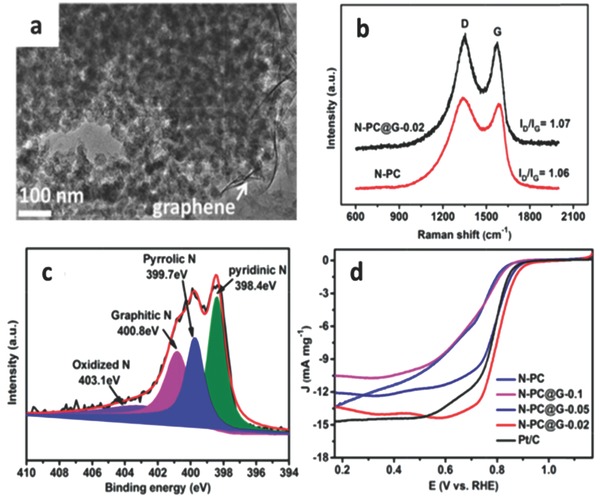
Figure 3.

a) TEM image of as‐prepared N‐PC@G‐0.02 composite. b) Raman spectra of the prepared N‐PC@G‐0.02 and N‐PC samples. c) High‐resolution N1s XPS spectra of N‐PC@G‐0.02 sample. d) LSV curves of ZIF‐8 derived carbon and commercial Pt/C electrocatalysts in O2‐saturated 0.1 m KOH solution at a scan rate of 10 mV s−1 and a rotating rate of 1600 rpm. Reproduced with permission.100 Copyright 2016, Elsevier.
