
Figure 3.
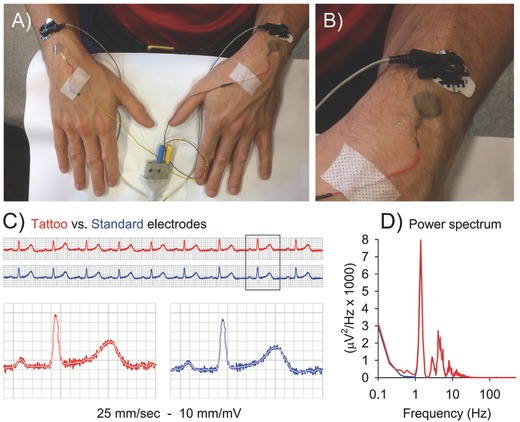
Comparison of lead I ECG simultaneous recording, performed with tattoo and standard electrodes. A and B) Experimental set‐up, tattoo, and standard electrodes having the same active area (diameter 16 mm). C) Sample of continuous recording (top) and sample of a single beat (bottom), obtained by tattoo (red) and standard (blue) electrodes. White line depicts the 40 Hz low‐pass filtered trace. D) Power spectrum of the two signals along 50 s recordings.