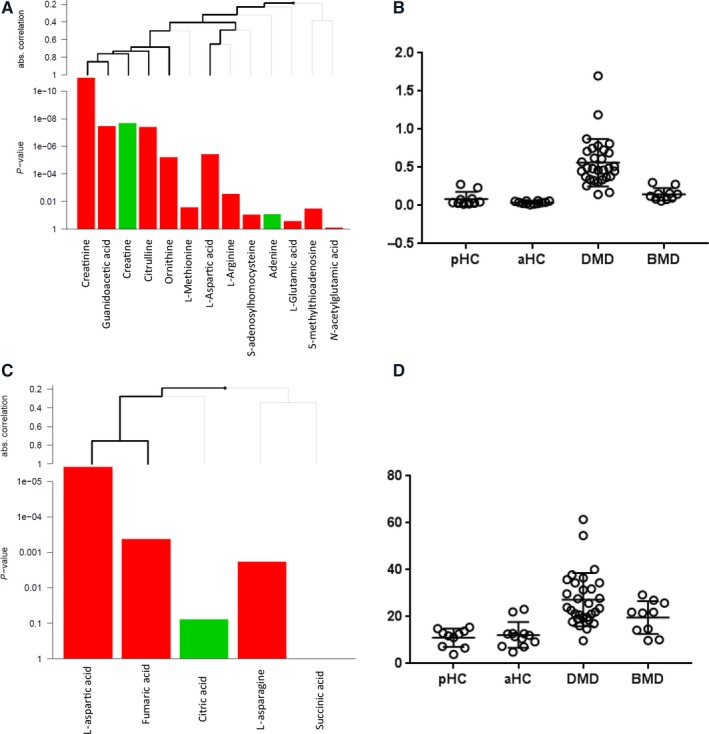
Figure 3.

Anticorrelating metabolites mapping to the same pathway. (A) Example of data analysis with the globaltest including pathway information. In this example, the contribution of each metabolite to the metabolism of polyamines pathway is presented. Lines above indicate the contribution of each metabolite or of a cluster of metabolites to the pathway score. Thick lines indicate significant contributions. The P‐values indicate the contribution of each metabolite to the pathway score. Green bars indicate higher metabolite corresponding area in DMD serum samples, while red bars indicate higher area in healthy control serum samples. (B) Scatter plot showing how the ratio between creatine and creatinine is able to discriminate between DMD, BMD and healthy. pHC is paediatric healthy controls, and aHC is adult healthy controls. (C) Citric acid and L‐aspartic acid opposite contribution to the alanine and aspartate metabolism pathway. (D) Scatter plot showing how the ratio between citric acid and L‐aspartic acid is able to discriminate between DMD, BMD and healthy
