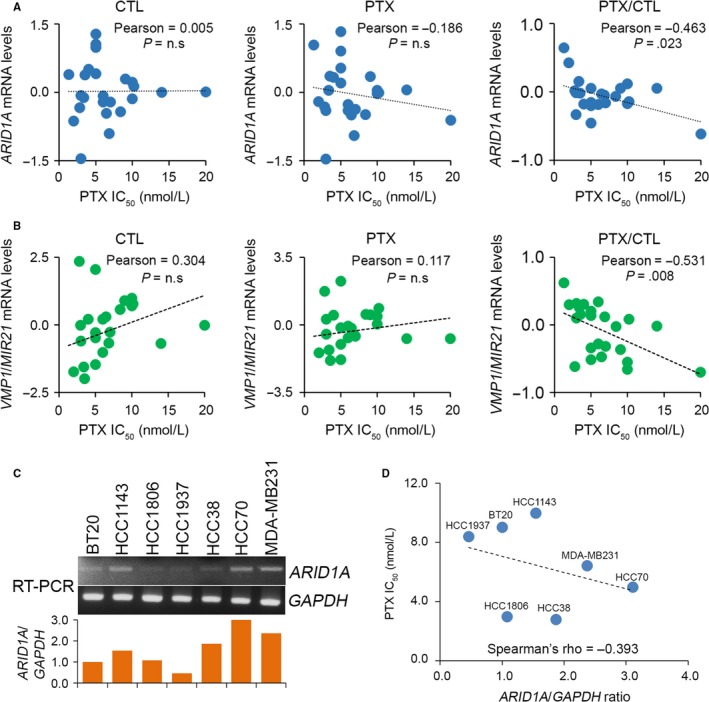
Figure 2.

ARID1A and VMP1/MIR21 negatively correlates with paclitaxel (PTX) IC 50 concentrations post‐treatment with PTX at IC 50 concentrations for 24 h in a panel of breast cancer cell lines. (A and B) Correlations among ARID1A and VMP1/MIR21 mRNA level and PTX IC 50 concentration in the tested breast cancer cell lines. The statistical significance of correlations was analysed using Pearson's test. The symbol “n.s” denotes not significant. Each dot in the dotplot indicates the median of mRNA levels from three independent experiments. (C) RT‐PCR analysis for ARID1A and GAPDH transcripts in TNBC cell lines (top). The levels of ARID1A transcript were normalized by comparing with the respective GAPDH level in the tested cell lines and shown as ratios (bottom). (D) Correlates between the normalized ARID1A levels and PTX IC 50 concentrations in a panel of TNBC cell lines. Spearman's correlation test was used to evaluate the statistical significance
