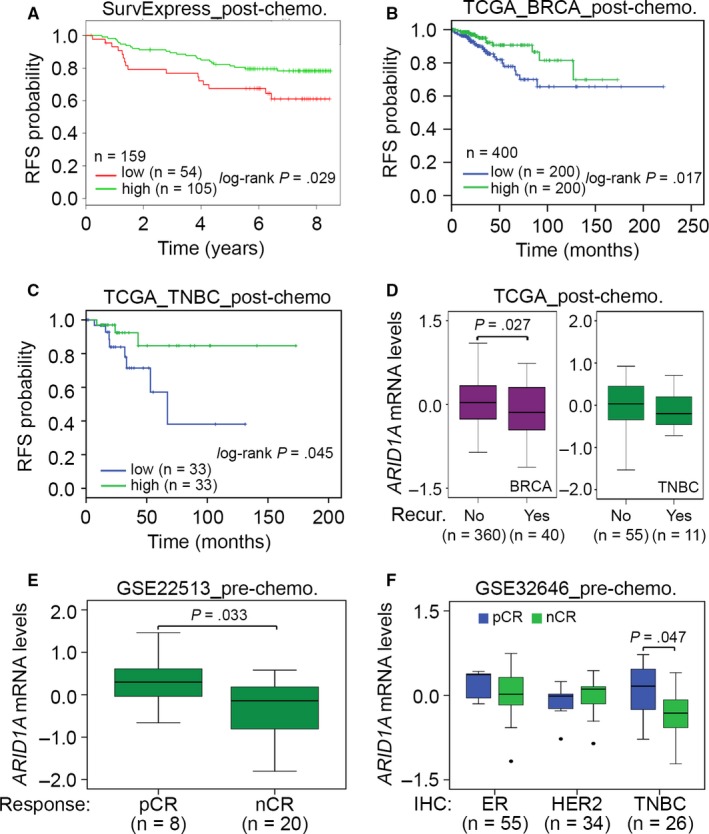
Figure 5.

ARID1A down‐regulation predicts a poor response to paclitaxel (PTX) chemotherapy in breast cancer patients. (A‐C) Kaplan‐Meier analysis for ARID1A expression under the condition of RFS probability in unclassified breast cancer patients and TNBC cohort with post‐operative chemotherapy using SurvExpress (A) and TCGA (B and C) databases. (D) Boxplot for mRNA levels of ARID1A in tumour biopsy derived from unclassified breast cancer patients and TNBC cohort receiving post‐operative chemotherapy without (No) or with (Yes) cancer recurrence using TCGA database. The statistical difference was analysed by t test. (E) Boxplot for mRNA levels of ARID1A in tumour biopsy derived from breast cancer patients with PTX pretreatment using GSE22513 data set. The statistical difference was estimated by non‐parametric Mann‐Whitney test. (F) Boxplot for mRNA levels of ARID1A in breast cancer tissues derived from ER(+), HER2(+) and triple‐negative, which identified by immunohistochemistry (IHC) analysis, breast cancer patients who received pre‐operative chemotherapy (pre‐chemo.) using GSE32646 data set. The statistical differences were analysed by one‐way ANOVA using Turkey's test. In (E) and (F) pCR and nCR denote pathological complete response and no pathological complete response, respectively
