Figure 6.

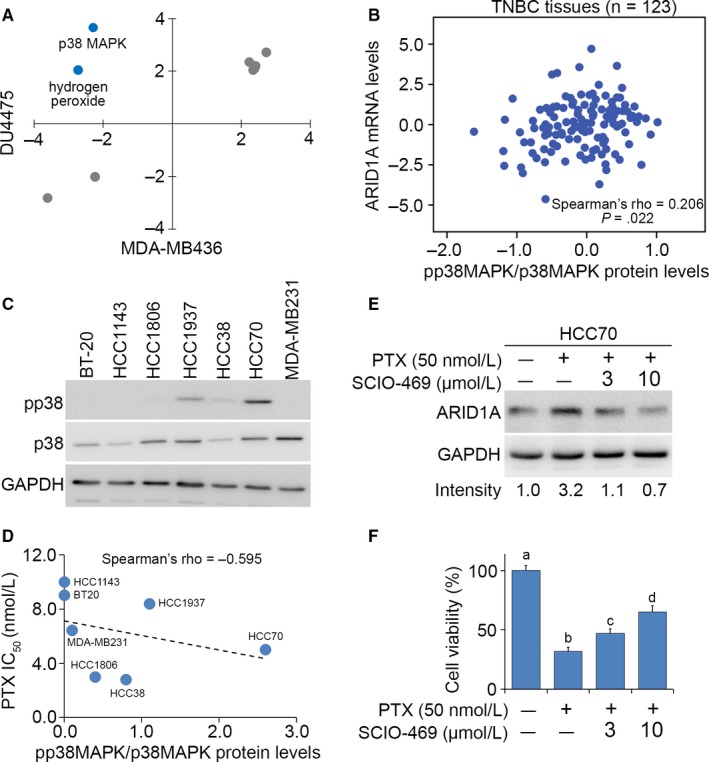
Possible mechanism underlying paclitaxel (PTX) resistance in breast cancer cells. (A) The in silico analysis of consensus upstream regulators that are possibly activated or inhibited after PTX treatment at the concentration of 10× IC 50 for 24 h in DU4475 and MDA‐MB436 cells using Ingenuity Pathway Analysis software. (B) Correlation between ARID1A mRNA levels and the protein levels of phosphorylated p38MAPK (pp38 MAPK) which was normalized with total p38MAPK protein levels using TCGA database. (C) Western blot analysis for pp38MAPK (pp38), p38MAPK (p38) and GAPDH proteins in the tested TNBC cell lines. (D) Correlation between PTX IC50 concentrations and normalized pp38MAPK protein levels in the tested TNBC cells lines. In (B and D) the statistical significance of correlations was analysed by using Spearman's test. (E) Western blot analysis for ARID1A and GAPDH proteins in HCC70 cells pre‐treated without or with p38MAPK inhibitor SCIO‐469 at 3 or 10 μmol/L prior to the treatment without or with PTX at 50 nmol/L for 24 h. In (C and E) GAPDH was used as an internal control of protein loading. (F) Cell viability of HCC70 cells that was treated by the procedure as shown in E. The different letters represent the statistical significance at P < .05 in non‐parametric Mann‐Whitney test
