
Figure 1.
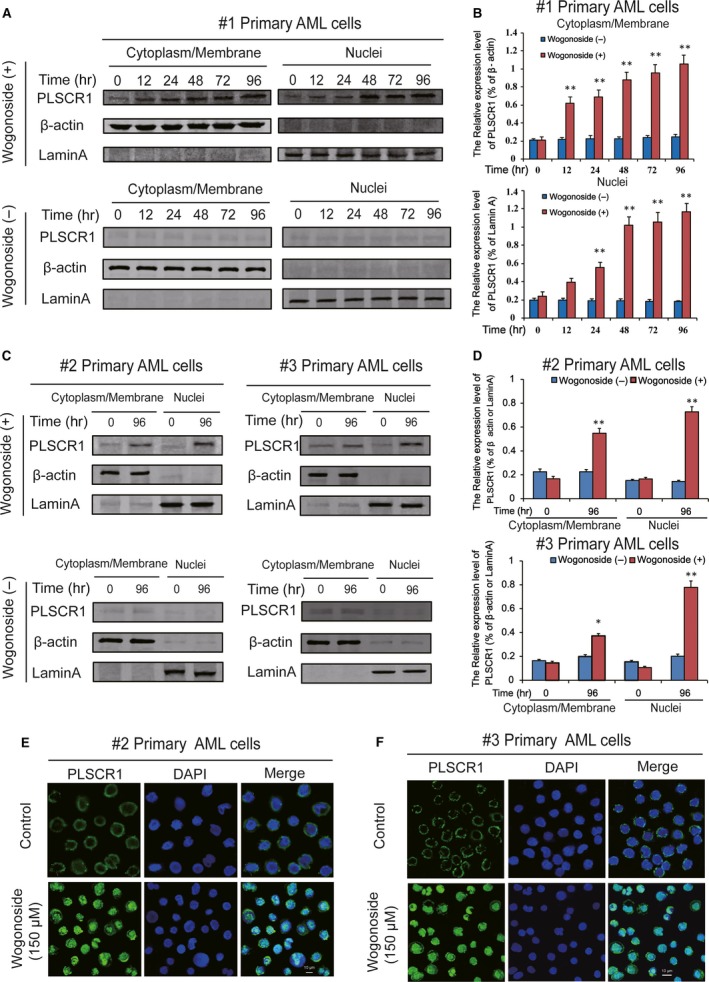
Nuclear distribution of PLSCR1 in different wogonoside responder's primary AML patient samples. (B) Cytoplasmic/membrane and nuclear fractions of the wogonoside responder′s cells (#1) were analysed by Western blot for the PLSCR1 protein, with β‐actin and laminA as cytoplasmic and nuclear loading controls, respectively. Each protein band was derived from different gels. (B) Data represent the mean ± SEM from three independent experiments. Asterisks denote statistically significant (*P < 0.05 and **P < 0.01) differences compared with controls by one‐way anova. (C) The other two wogonoside responder′s samples (#2 and #3) were analysed by Western blot for the nuclear translocation of PLSCR1, with β‐actin and laminA as cytoplasmic and nuclear loading controls, respectively. (D) Data represent the mean ± SEM from three independent experiments. Asterisks denote statistically significant (*P < 0.05 and **P < 0.01) differences compared with controls by one‐way anova. (E, F) Immunofluorescence of 150 μM wogonoside‐treated primary AML cells (#2 and #3) for 96 hrs costained with anti‐PLSCR1 (primary)/Alexa Fluor® 488‐labelled donkey anti‐goat (secondary) antibody combinations (green fluorescence), as well as DAPI (blue fluorescence), to visualize the nuclei. They were detected by confocal microscopy (FV1000; Olympus, Tokyo, Japan) with FV10‐ASW2.1 acquisition software (Olympus) at room temperature (Original magnification ×1000; immersion objective ×100 with immersion oil type F). Images are representative of 3 independent experiments.