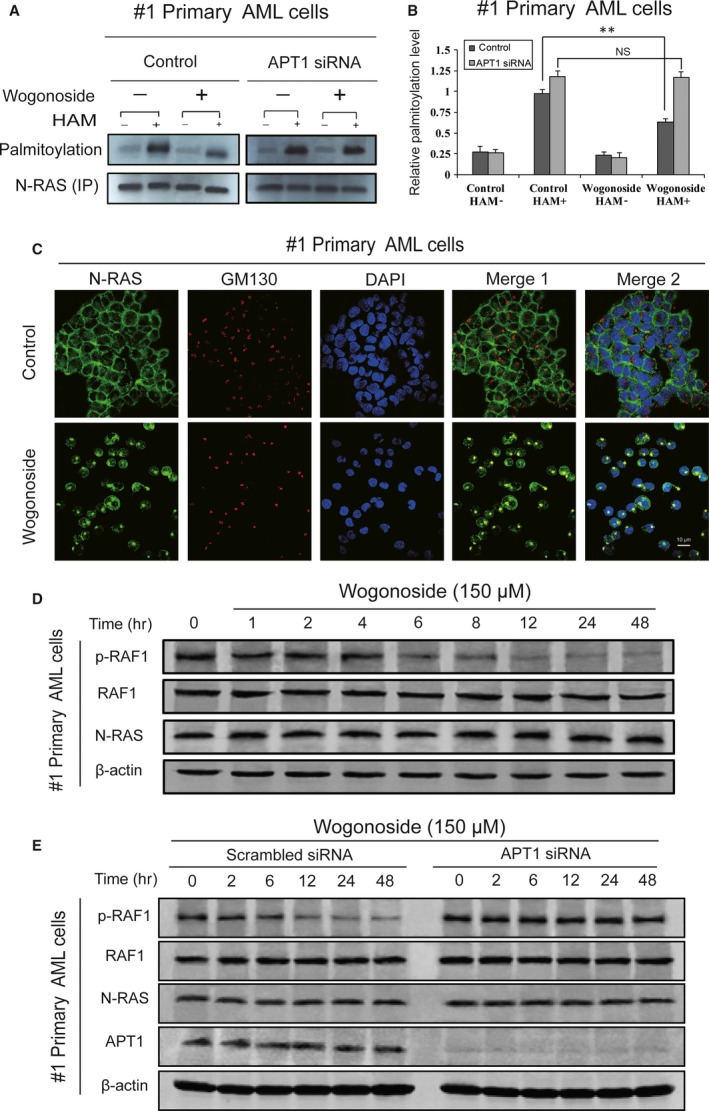
Figure 6.

Effects of wogonoside on N‐RAS in primary AML cells. (A) #1 primary AML cell was transfected with APT1 siRNA treated with or without 150 μM wogonoside for 48 hrs, and the palmitoylation level of N‐RAS was detected by IP‐ABE assay. (B) The data represent the mean ± SEM of 3 different experiments. Asterisks denote statistically significant (*P < 0.05 and **P < 0.01) differences compared with controls by one‐way ANOVA. (C) Immunofluorescence of 150 μM wogonoside‐treated #1 primary AML cells for 48 hrs was performed. Cells were collected and were costained with anti‐GM130 (primary)/Alexa Fluor® 555 Donkey antimouse (secondary) antibody (red fluorescence) combinations anti‐N‐RAS (primary)/Alexa Fluor® 488 Goat anti‐Rabbit (secondary) antibody (green fluorescence), as well as DAPI (blue fluorescence). They were detected by confocal microscopy (FV1000; Olympus, Tokyo, Japan) with FV10‐ASW2.1 acquisition software (Olympus) at room temperature (Original magnification ×1000; immersion objective ×100 with immersion oil type F). Images are representative of 3 independent experiments. (D) #1 primary AML cells were cultured for 0, 1, 2, 4, 6, 8, 12, 24 and 48 hrs with 150 μM wogonoside. Whole‐cell extracts at different time‐points were analysed by Western blotting for expression levels of N‐RAS, RAF1 and p‐RAF1, using β‐actin as a loading control. The data represent the mean ± SEM of 3 different experiments. (E) #1 primary AML cells were transfected with non‐specific siRNA and APT1 siRNA treated with or without 150 μM wogonoside for 0, 2, 6, 12, 24 and 48 hrs. Whole‐cell extracts at different time‐points were analysed by Western blotting for expression levels of APT1, N‐RAS, RAF1 and p‐RAF1, using β‐actin as a loading control. The data represent the mean ± SEM of three different experiments.
