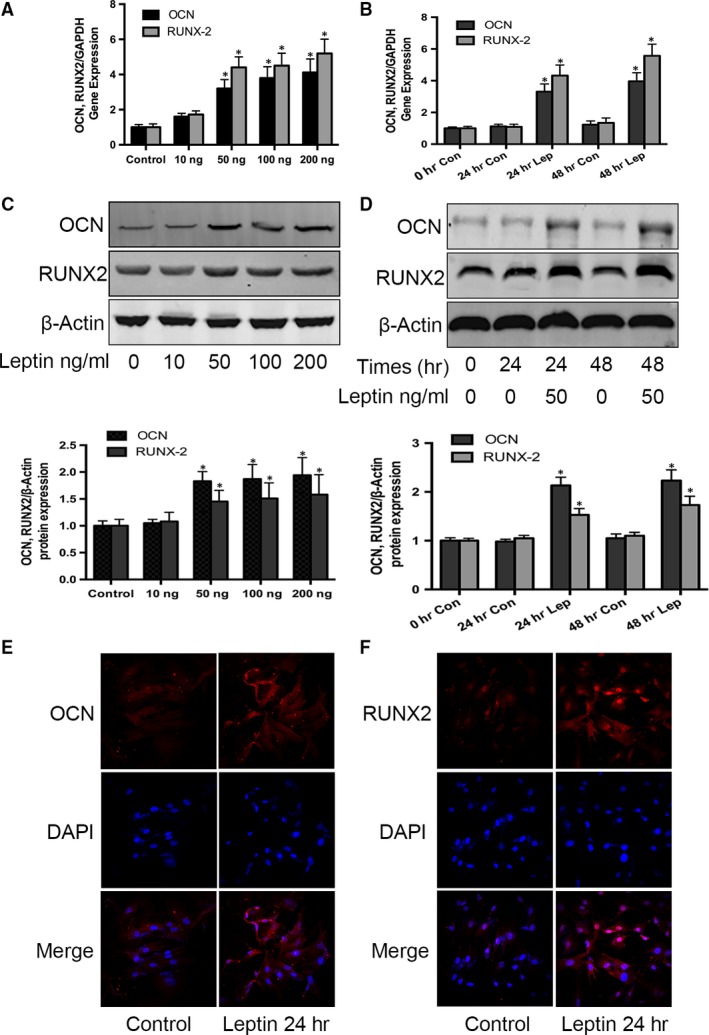
Figure 3.

Effect of leptin on OCN and Runx2 expression in CEP cells. Following two passages, primary rat CEP cells were cultured in six‐well plates. Cultured cells were treated with 0, 10, 50, 100 or 200 ng/ml leptin for 48 hrs. RNA levels of OCN and Runx2 were quantified using real‐time PCR (A,B) and protein levels quantified using Western blotting and compared to the untreated control with normalization against b‐actin (C,D). Cultured cells were also treated with and without 50 ng/ml leptin or OCN for 24 and 48 hrs. OCN and Runx2 protein expression was further determined using immunocytochemistry (E,F); blue indicates the nucleus, and red indicates protein expression. Data represent the mean with S.D. of triplicate samples from three independent experiments. Treatments that were significantly different from the 0‐hr controls are indicated with asterisks (*P < 0.05).
