
Figure 3.
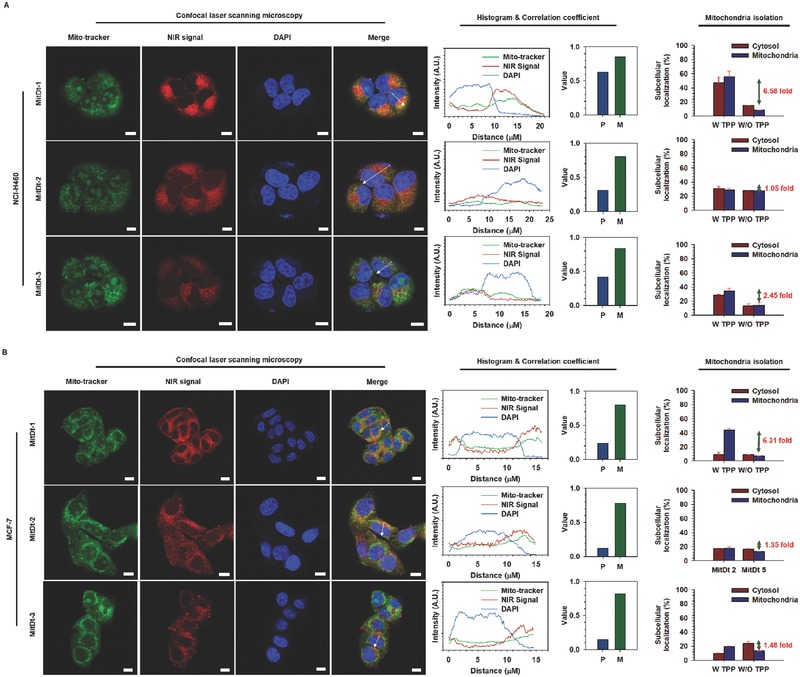
Subcellular localization of MitDt compounds. Mitochondrial localization of MitDt‐1, MitDt‐2, and MitDt‐3 was evaluated using confocal laser scanning microscopy. NCI‐H460 A) and MCF‐7 B) cancer cells were stained with mitotracker (MitoTracker Orange CMTMRos) and incubated. After that, both cell lines were incubated with MitDt‐1 and MitDt‐3, followed by fixation using 4% paraformaldehyde. Nuclei were counterstained with DAPI. The distances in the fluorescence profiles were indicated by dash lines (Scale bar = 10 µm). P (Pearson's correlation coefficient) and M (Manders overlap coefficient) between the Mito‐tracker and NIR signal were obtained using the ZEN2 program (Carl Zeiss, Germany). Quantification of MitDt compounds on mitochondria was confirmed using mitochondria isolation kit (W TPP: MitDt compounds, W/O TPP: Pre‐MitDt compounds).