Figure 4.

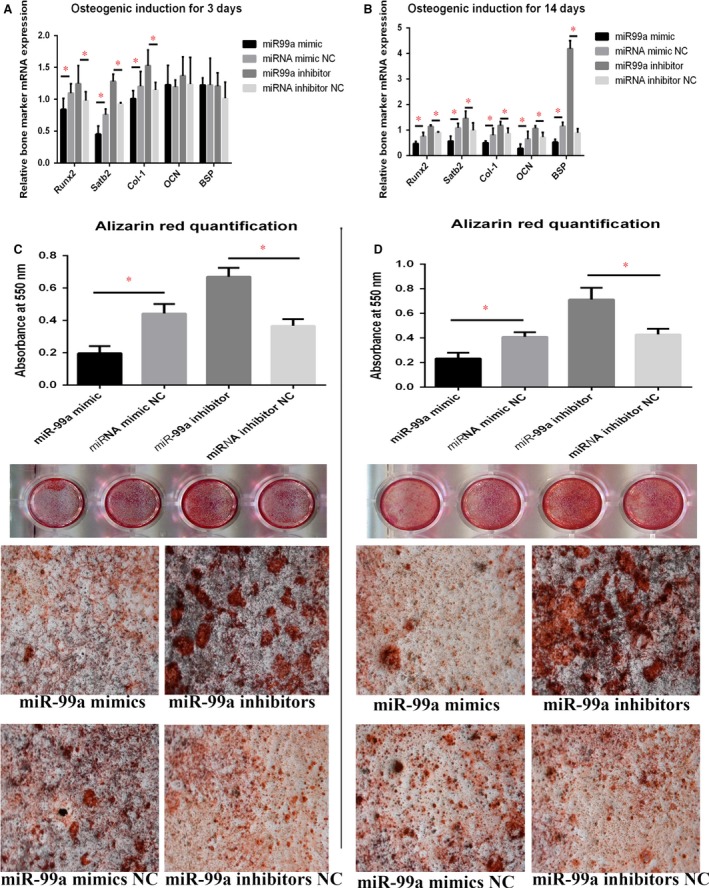
Gain‐ and loss‐of‐function analyses in BMSCs cell cultures suggested that miR‐99a suppresses osteogenic differentiation of BMSCs. (A) qRT‐PCR showed that the mRNA levels of Runx2, Satb2, Col‐I were significantly increased by miR‐99a inhibitors after osteogenic induction for 3 days. (B) qRT‐PCR showed that the mRNA levels of Osteocalcin (OCN) and Bone sialoprotein (BSP) mRNA levels were also increased by miR‐99a inhibitor after osteogenic induction for 14 days. (C) Mineralization of BMSCs was assayed by Alizarin red staining after 21 days of incubation showed that mineralization was significantly reduced in response to miR‐99a mimics in miR‐99a mimics group, compared to negative control groups, while inhibitors group has the increased level of mineralization. (D) Mineralization assay was verified using BMSCs incubated for 28 days. The lower two panels of C and D are representative bright‐field micrographs (100×) of the cultures scanned in the upper panels of C and D, respectively. Data are shown as mean ± S.D. *P < 0.05.
