Figure 7.

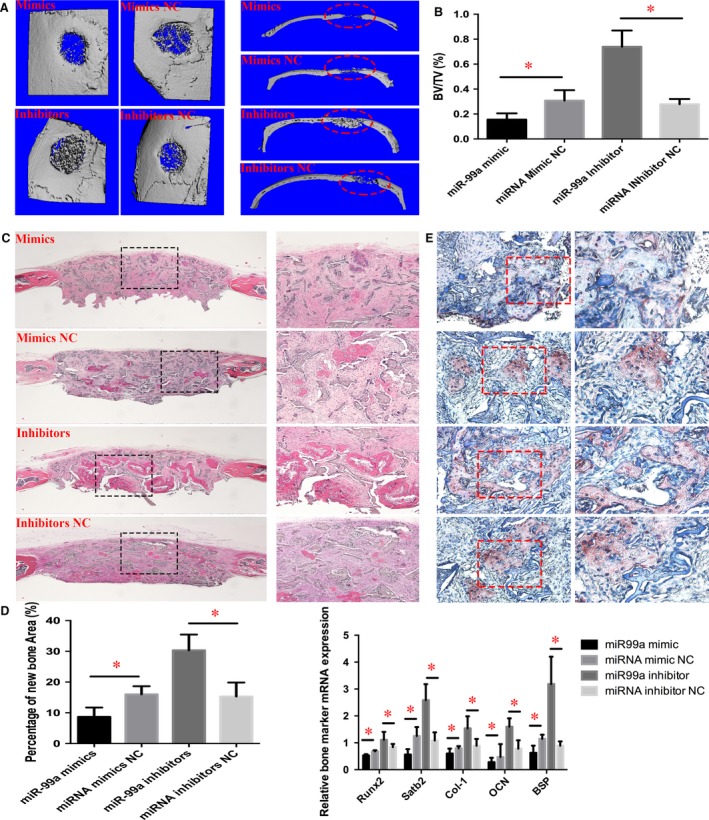
Bone healing enhanced by inhibition of miR‐99a in BMSCs. (A) micro CT evaluation showed that more newly formed bone filled the defects of the miR‐99a inhibitors‐modified BMSCs group. Right panel, coronal section of cranial samples. (B) Quantification of the new bone regeneration within the calvarial defects. BV/TV was significantly higher for the miR‐99a inhibitors‐modified BMSCs group, and much less bone in miR‐99a mimics‐modified BMSCs group, when compared to NC groups. (C) Histological evidence further supported the micro CT results, indicating that the specimens from the miR‐99a inhibitors‐modified BMSCs group showed extensive new bone formation. Left panel, 40×; right panel, 100×. (D) Percentage of newly formed bone in different treatment groups measured in H&E staining sections. (E) Immunohistochemical analysis of newly formed bone. Left panel, 200×; right panel, 400×. The labels of group images were the same as in (C). Stronger OCN expression was observed in the newly formed bone area in the miR‐99a inhibitors‐modified BMSCs group. (F) qRT‐PCR analysis of bone marker genes in bone defect tissue. Data are shown as mean ± S.D. *P < 0.05.
