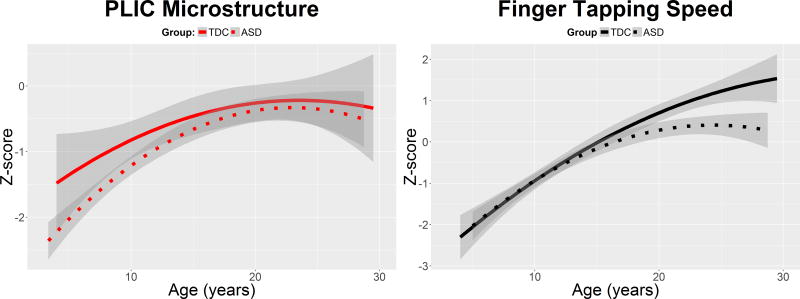
Figure 4.
PLIC microstructure and finger-tapping speed as a function of age in both the group with autism spectrum disorder (ASD) (dotted line) and the group with typical development (TDC) (solid line). These data correspond to the cross-sectional (Time 1) data used in the moderated mediation analysis. To maximize comparison between the graphs, the PLIC microstructure and finger-tapping speed were normalized using z-scores. The graphs demonstrate that the group differences in PLIC are most prominent at younger ages, whereas the group differences in finger-tapping speed are most prominent at older ages.

