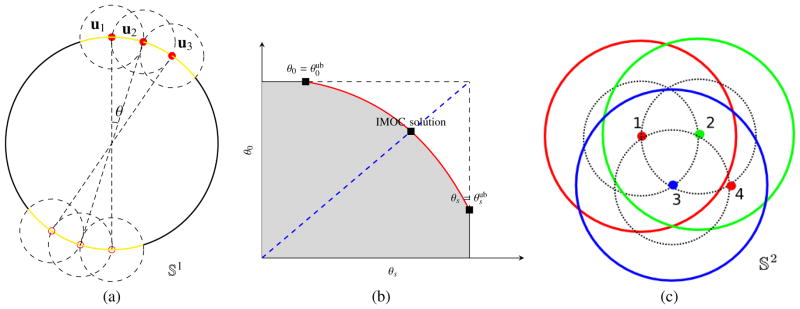
Fig. 1. Sketch map of IMOC.
(a) demonstrates MOC algorithm 2 for P-C-S in 𝕊1, where u1, u2 and u3 are selected one by one with a given θ, and the yellow arc denotes the total coverage set. Figures (b) and (c) are sketch maps for the multi-shell case P-C-M. (b) shows the compromise between the covering radius θ0 in the combined shell and the covering radius θs in the s-th shell, and demonstrates the binary search path (the dashed blue line segment) and the obtained covering radii in IMOC. The grey area contains all feasible covering radii, and the red curve denotes all Pareto optimal covering radii. (c) demonstrates MOC for 3 shell case. Three colors denote three shells. The numbers near the points are the selection orders in MOC for the points. Point 1 (i.e., u1,1) is first selected for shell 1, then point 2 (u2,1) for shell 2 and point 3 (u3,1) for shell 3. The red circle around u1,1 denotes its coverage set C(u1,1, θ1) which is added to CS1, and the dashed black circle around u1,1 denotes C(u1,1, θ0) which is added to CS0. Point 4 (u1,2) is selected based on CSs, ∀s = 0, 1, 2, 3.

