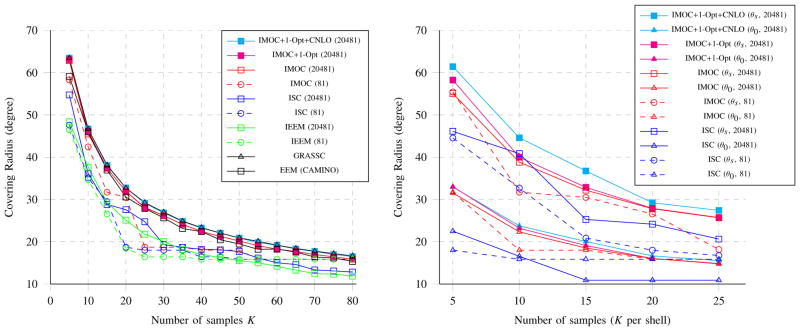
Fig. 2. Effect of discretization.
The left figure shows the covering radii of single shell schemes with K samples obtained by methods using two uniform sets with 81 samples and 20481 samples. The right figure shows the covering radii of multi-shell schemes with K × 3 samples, where θs is the mean of covering radii in three shells, and θ0 is the covering radius of the combined shell.

