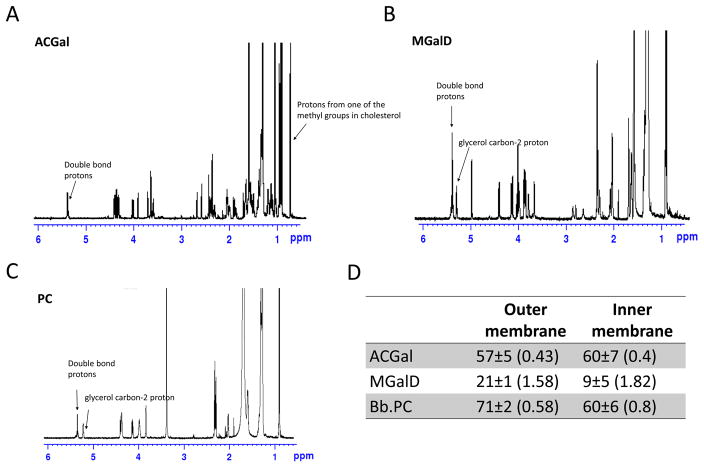
Figure 4.
Double bond content of outer and inner membrane major lipids. A. 1H-NMR spectrum of B. burgdorferi PC. B. 1H-NMR spectrum of B. burgdorferi ACGal. C. 1H-NMR spectrum of B. burgdorferi MGalD. D. Lower limit percent of saturated acyl chains in the outer and inner membranes; in parenthesis is shown the average double bonds per acyl chain. Error bars denote standard deviation from three replicates.

