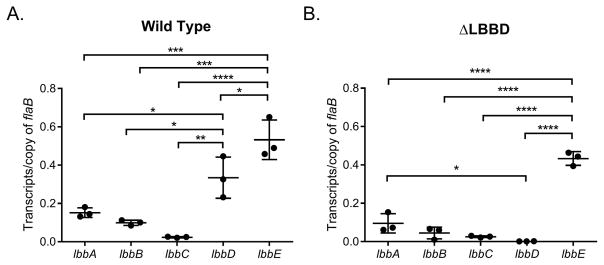
Fig. 8. Bactofilin transcript levels do not change to compensate for the loss of lbbD transcripts.
Quantitative RT-PCR analysis of the transcript levels of the five bactofilin genes in wild type and mutant strains. Transcript from each gene was normalized to 1 copy of flaB transcript. Each point represents a biological replicate (averaged from 3 technical replicates) from independent RNA preparations ± the standard deviation. Ordinary one-way ANOVA was applied to determine statistical differences (* denotes P value < 0.05, ** denotes P value < 0.01,*** denotes P value < 0.001, **** denotes P value < 0.0001).

