
Figure 3. ADE levels of complement regulatory proteins in cross-sectional control and AD groups.
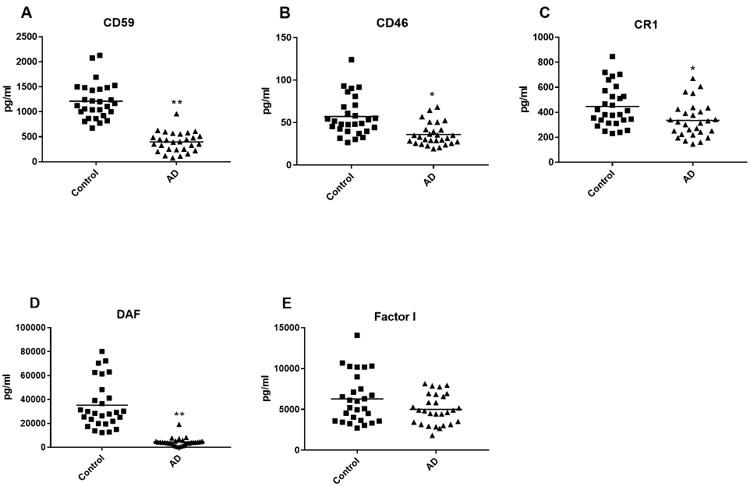
Each point represents the value for a control subject or AD patient and the horizontal line in point clusters is the mean level for that group. Mean±S.E.M. control and AD patient values, respectively, are 1211±68.5 pg/ml and 398±37.1 pg/ml for CD59, 57.2±4.39 pg/ml and 36.1±2.47 pg/ml for CD46, 447±31.4 pg/ml and 336±26.1 pg/ml for CR1, 35,197±3735 pg/ml and 4,563±654 pg/ml for DAF, and 6281±562 pg/ml and 5010±346 pg/ml for factor I. The significance of differences between values for controls and AD patients was calculated by an unpaired Student's t test; *= p<0.01 and **=p<0.0001.