
Figure 4. ADE levels of complement proteins and cytokines in the longitudinal study.
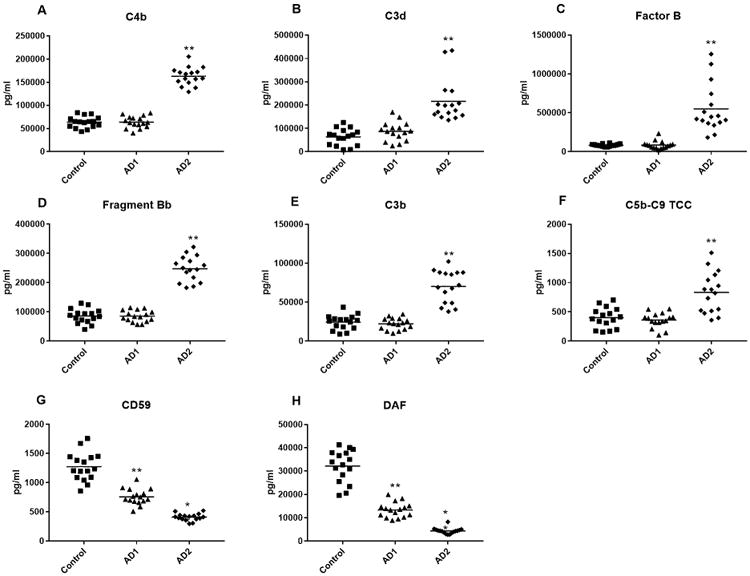
Each point represents the value for a control subject or AD patient and the horizontal line in point clusters is the mean level for that group. Control, AD1 patient and AD2 patient values (mean±S.E.M.), respectively, are 63,621±3056, 63,901±3130 and 163,273±4864 for C4b, 62,958±8,945, 86,911±10,020 and 215,660±23,018 pg/ml for C3d, 82,681±3,921, 84,385±12,808 and 548,930±77,855 pg/ml for complement factor B, 85,716±6181, 85,123±4836 and 247,574± 10,740 pg/ml for factor B fragment Bb, 24,347±2350, 22,212±1866 and 70,039±5245 pg/ml for C3b, 400±43.4, 359±31.7 and 832±87.2 pg/ml for C5b-C9 TCC; 1272±61.4, 757±33.6 and 409±15.4 pg/ml for CD59, and 32,123±1733, 13,352±803 and 4369+320 pg/ml for DAF. The significance of differences between values for controls and AD1 patients was calculated by an unpaired Student's t test and for differences between values for AD1 and AD2 patients was calculated by a paired Student's t test; **=p<0.0001.