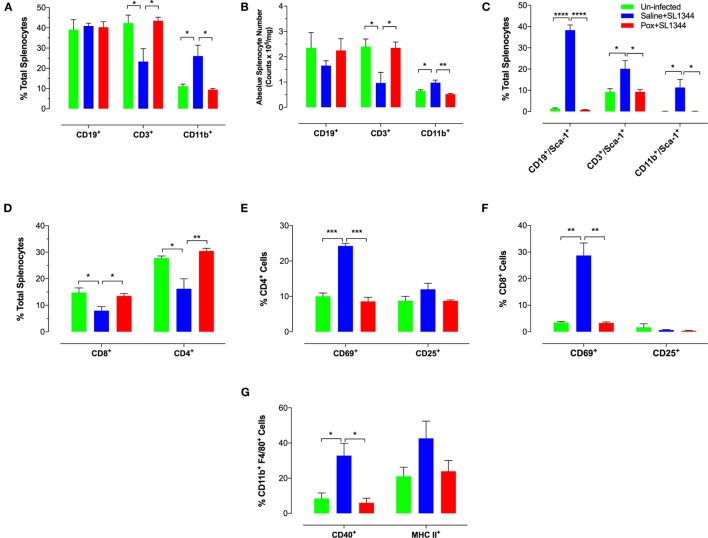
Figure 3.
Immunophenotypic analysis of spleen cell subpopulations following oral infection with virulent Salmonella. Saline or paraoxon-pretreated mice were orally infected with SL1344 and analyzed by FACS 7 days later. (A,B,D) Spleen cells were immunophenotyped using lineage specific markers for B cells (CD19), myeloid cells (CD11b), T cells (CD3), and T cell subsets (CD4, CD8). (C) Relative expression of Sca-1 on the three major subpopulations was uses to assess general activation status. (E,F) Expression levels of CD69 and CD25 on CD4 and CD8 T cell subsets. (G) Expression of CD40 and MHC class II proteins on splenic CD11b+F4/80+ macrophages was also analyzed. Data are mean values ± SEM from a representative of three independent experiments (n = 4–5/group). Asterisks denote statistically significant differences between groups (*p < 0.05, **p ≤ 0.01, ***p < 0.001, ****p < 0.0001).

