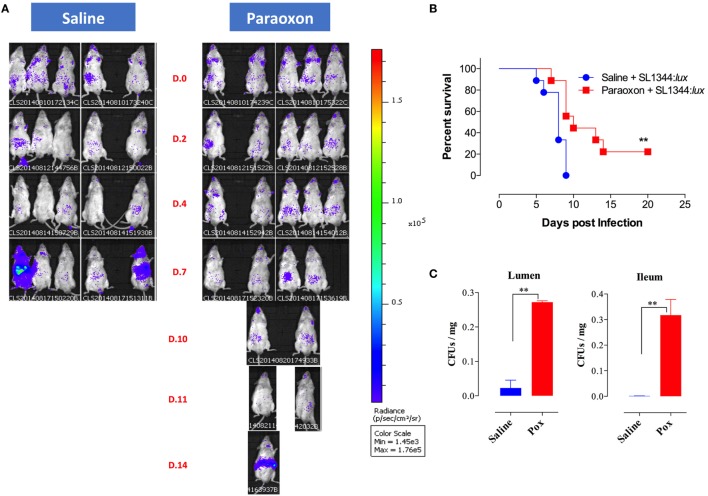
Figure 6.
In vivo bioluminescent imaging of Salmonella-infected mice. Following saline or paraoxon pretreatment, mice were orally infected with SL1344:lux [1 × 10⁵ colony-forming units (CFUs)/mouse]. (A) Mice were imaged ventrally starting at 3 h postinfection (Day 0 or D.0) and followed until day 20 postinfection. Data are representative of two independent experiments (five mice/group). Color scale ranges from 1,450 (purple) to 176,000 photons/sec/cm3/sr (red). (B) Animals were also followed for survival. The graph represents the mean values ± SEM of pooled data from two independent experiments (n = 9 mice/group). Asterisks denote statistically significant differences [log-rank (Mantel–Cox) statistical test] between the control and experimental groups (**p < 0.01). (C) Bacterial loads in the small intestine following oral infection with SL1344. Bacterial CFUs were determined in the lumen of the small intestine and in the ileum at days 1 and 3 postinfection, respectively. Graphs depict mean values ± SEM of 3–4 mice/group from a representative one of two independent experiments. Asterisks denote statistically significant differences between the indicated groups (**p < 0.01).

