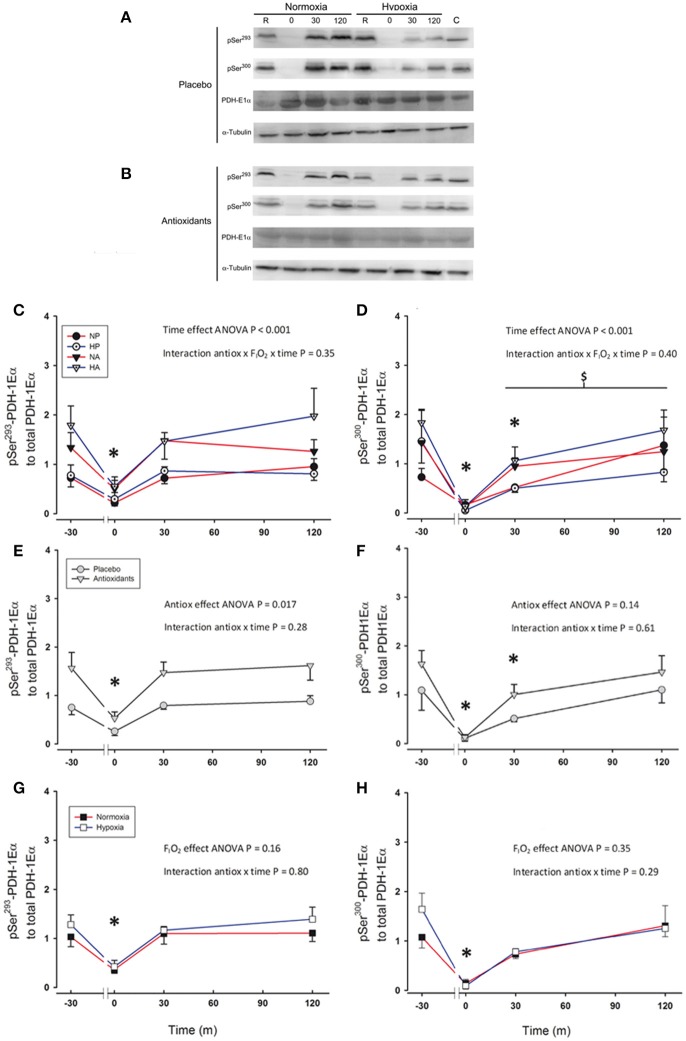
Figure 3.
Representative western blots for Ser293-PDH-1Eα and Ser300-PDH-1Eα phosphorylations and PDH-1Eα total protein expression in response to a single 30 s sprint after placebo (A) or antioxidants (B) intake. Levels of Ser293-PDH-1Eα phosphorylation to PDH-1Eα total protein expression (C,E,G), and Ser300-PDH-1Eα phosphorylation to total PDH-1Eα total protein expression (D,F,H) before, immediately after, 30 and 120 min following the end of a single 30 s all-out sprint (Wingate test). (C,D) Responses to sprints performed in normoxia placebo (black circles), hypoxia placebo (open circles, FIO2: 0.105), normoxia antioxidants (black triangles) and hypoxia antioxidants (open triangles; FIO2: 0.105). (E,F) Represent the responses observed for two placebo conditions (gray circles) averaged compared to the average of the two antioxidants conditions (gray triangles). (G,H) Represent the responses for the average of the normoxic conditions (black squares) compared to the average of the hypoxic conditions (open squares; FIO2:0.105). *P < 0.05 in comparison to resting (ANOVA, time main effect). $P < 0.05 compared to Ser293-PDH-1Eα phosphorylation recovery. n = 9 for all variables.

