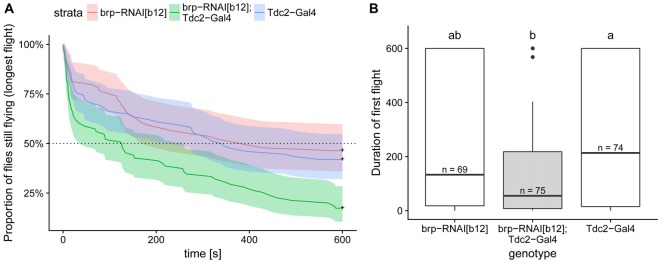
Figure 8.
Expression of BRP-RNAi in octopaminergic and tyraminergic cells led to a decreased flight duration compared to the two genetic controls. (A) Kaplan Meier survival curve of the longest of the three first flights. This analysis, which is the most suited to this type of right-censored data, detect the difference between test and control flies (Cox proportional hazards regression model, corrected p < 0.004 with Bonferroni corrections). (B) Duration of the first flight is shown in order to compare the values with the one reported in Brembs et al. (2007). Boxplots represent the median (bar), the 75%- and 25%-quartiles (box) and all the residual data points (whiskers). Letters indicate statistically significant difference between groups (Wilcoxon rank sum test with bonferroni corrections for multiple comparisons, corrected p < 0.05). N-values are the number of animals examined. Data availability: behavioral data and its analysis are available at: https://doi.org/10.5281/zenodo.1160648.

