
Figure 1.
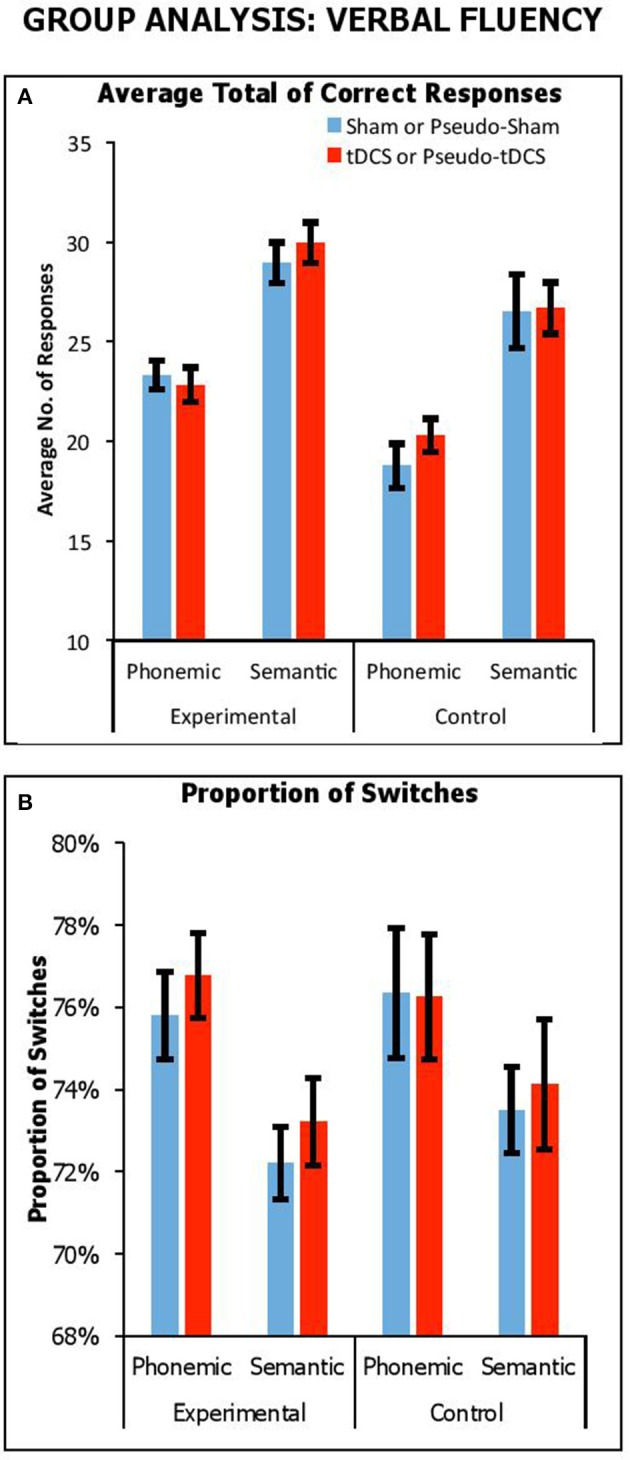
Performance across stimulation conditions (sham vs. tDCS conditions for experimental group; pseudo-sham vs. pseudo-tDCS for control group) and fluency tasks in terms of overall average no. of correct responses (A) and proportion of switches (i.e., average no. of switches over average response) expressed as a percentage (B). Error Bars indicate Standard Error.