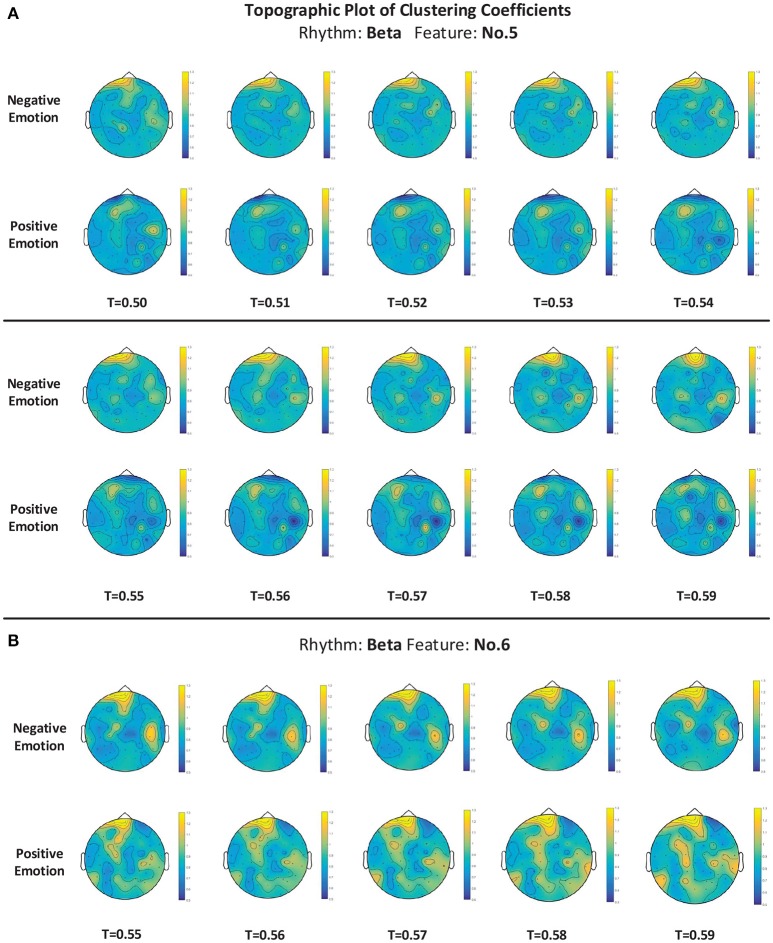
Figure 9.
(A,B) The topographic plot of the clustering coefficient of the groups of negative emotion and positive emotion when feature No. 5 (Hjorth parameter: mobility) and feature No. 6 (Hjorth parameter: complexity) in beta rhythm were utilized. Conditions with different thresholds (T) are illustrated.

