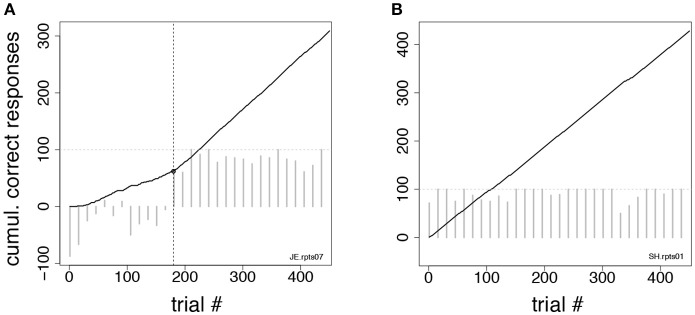
Figure 3.
Change-point procedure. Two examples of the change-point procedure used to determine the number of trials-to-criterion in the tasks of Figures 2C,D (see section Methods). In both panels, full lines show the cumulative record of correct responses, which grows by one for each correct trial (see section Methods). Gray bars show the difference in correct rates between trial types in successive blocks of 15 trials (the horizontal dotted line marks 100% difference in correct rates between trial types). The time-course of the difference in correct rates confirms the validity of the procedure but was not used to find the change-point. (A) In this example, the change-point (vertical broken line) marks the successful reversal of the cue-outcome association task of Figure 2C on the first day the experimenter had reversed the task (monkey JE). The change-point was reached at trial 180 (corresponding to 48 completed trials). (B) Cumulative record of correct responses for monkey SH during the first day of exposure to the same task as in (A). The cumulative record is a straight line implying immediate acquisition of the task, as is apparent from the time course of the difference in correct rates (gray bars). The overall percent correct (with 99% confidence interval) was 91.8 < 95.1 < 97.1. No valid change-point was found in this case, and the first of 10 consecutive correct responses was used as a criterion, according to which acquisition of the task occurred after 6 completed trials.

