Fig. 3.

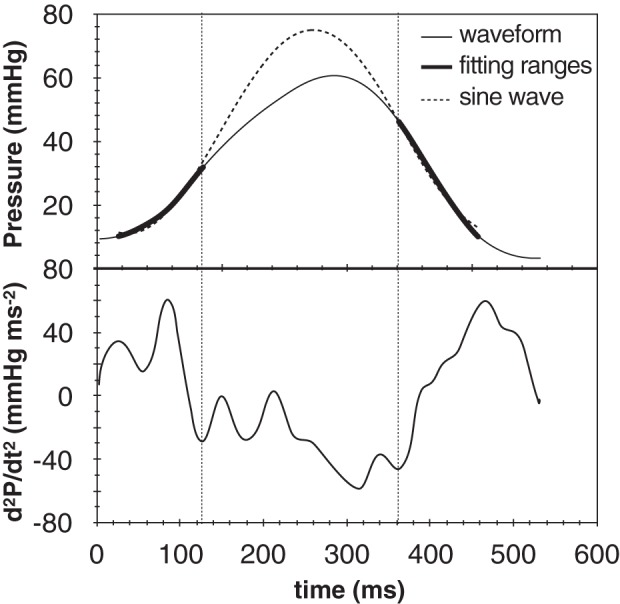
Example RV pressure trace, whose second derivative exhibited multiple minima. The same minima were selected by all 3 independent observers, as they resulted in the best interpolation of the isovolumic ranges.

Example RV pressure trace, whose second derivative exhibited multiple minima. The same minima were selected by all 3 independent observers, as they resulted in the best interpolation of the isovolumic ranges.