Abstract
The accurate representation of the human airway anatomy is crucial for understanding and modeling the structure-function relationship in both healthy and diseased lungs. The present knowledge in this area is based on morphometric studies of excised lung casts, partially complemented by in vivo studies in which computed tomography (CT) was used on a small number of subjects. In the present study, we analyzed CT scans of a cohort of healthy subjects and obtained comprehensive morphometric information down to the seventh generation of bronchial branching, including airway diameter, length, branching angle, and rotation angle. Although some of the geometric parameters (such as the child-to-parent branch diameter ratio) are found to be in line with accepted values, for others (such as the branch length-to-diameter ratio) our findings challenge the common assumptions. We also evaluated several metrics of self-similarity, including the fractal dimension of the airway tree. Additionally, we used phase-contrast magnetic resonance imaging (MRI) to obtain the volumetric flow field in the three-dimensional-printed airway model of one of the subjects during steady inhalation. This is used to relate structural and functional parameters and, in particular, to close the power-law relationship between branch flow rate and diameter. The diameter exponent is found to be significantly lower than in the usually assumed Poiseuille regime, which we attribute to the strong secondary (i.e., transverse) velocity component. The strength of the secondary velocity with respect to the axial component exceeds the levels found in idealized airway models and persists within the first seven generations.
NEW & NOTEWORTHY We performed a comprehensive computed tomography-based study of the conductive airway morphology in normal human subjects, including branch diameter, length, and mutual angles. We found significant departure from classic homothetic relationships. We also carried out MRI measurements of the three-dimensional inspiratory flow in an anatomy-based model and directly assessed structure-function relationships that have so far been assumed. We found that strong secondary flows (i.e., transverse velocity components) persist through the first seven generations of bronchial branching.
Keywords: airway morphometry, computed tomography, magnetic resonance imaging, structure-function relationship
INTRODUCTION
The structure of the human lungs, in particular of the airway tree and its relation to the pulmonary function, has been the subject of intense research efforts. The geometric properties of the bronchi determine important physiological parameters such as the resistance of the conducting airways (19, 60). These, in turn, influence gas mixing along with the transport and deposition of particles and thus the response to the inhalation of both harmful and therapeutic substances (37, 38).
The understanding and modeling of the bronchial structure has often been based on classic morphometric studies (24, 25, 66, 81). The latter have identified, especially for the dichotomously bifurcating conducting airways, common proportions in terms of, for example, branch length-to-diameter ratio and child-to-parent branch diameter ratio. The consistency of such proportions beyond the inter- and intrasubject variability indicates that the bronchial tree has a self-similar structure (58, 80). It has indeed been remarked that, at least over a certain range of scales, the airway tree displays a fractal architecture (15, 16, 47, 82). Moreover, the values of the geometric parameters and their ratios suggest a significant degree of optimality of the human lung structure. For example, the child-to-parent branch diameter ratio (or homothety ratio) was found to approximate closely 2−1/3 (81), which minimizes airflow resistance and entropy production (55, 84, 85). The structure of a self-similar tree is typically described by its fractal dimension (df), although several practical definitions exist that are analogous to each other only for simple mathematical constructs. The formal definition relates to the Hausdorff dimension, which is closely related to the box-counting dimension (db) used in several biological settings, including imaging of lung tissues (42). Other metrics of self-similarity can be defined based on widely used physiological relationships. Murray (55) first pointed out that, assuming the flow in a branch or vessel is described by the Poiseuille's solution (valid for fully developed laminar flow in a circular tube), then the optimum flow that minimizes dissipation while maintaining biological viability is obtained for:
| (1) |
where Q is the volumetric flow rate and C is a constant that depends on the organ and the fluid in question. It was later pointed out that the diameter exponent (D) is regime-dependent, i.e., Q = CDn, with n = 3 for laminar flow and n = 2.333 for turbulent flow (76). Assuming the branch geometry does not vary significantly while the fluid flows and that the flow regime does not change along the bifurcation, continuity requires:
| (2) |
with m = n. Here, the subscripts par, min, and maj denote the parent branch, the child branch of smaller diameter, and the child branch of larger diameter, respectively. To date, n has not been directly evaluated in airways due to the difficulty of performing detailed three-dimensional (3-D) flow measurements in vivo, ex vivo, or even in vitro. On the other hand, m was estimated from morphometry to be between 2.7 and 3.0 in various mammal vascular beds (33) and ~3.0 in the bronchial tree (26, 35, 45). In general, m was found to be fairly consistent along the tree, which Mandelbrot (46) saw as proof that biological trees possess a fractal structure.
The symmetric Weibel model and the asymmetric Horsfield model have been adopted in numerous studies investigating respiratory fluid dynamics, both experimentally (14, 28, 29, 70) and numerically (6, 10, 51, 59, 77, 89). These models possess great simplicity and allow focusing on fundamental aspects of the air and particle transport that transcend anatomic variability while enabling direct comparison among studies. On the other hand, they are based on a small number of airway casts, on which accurate and repeatable geometry measurements are difficult (69, 75). Moreover, different excision and casting techniques may affect the morphometric results (75). In the last decades, advances in medical imaging, especially computed tomography (CT), have enabled the in vivo measurement of the geometry of the central conducting airways in normal patients, providing information on bronchial length, diameter, and 3-D bifurcation angles. Still, most of these studies only considered 1 subject (69, 73), with only 1 study considering 10 subjects (54). Moreover, many studies have focused exclusively on airway lumen and wall thickness because of their relevance to obstructive lung disease (1, 20, 56). Finally, morphometric parameters are often reported only as averages across all reconstructed branches. Generation-by-generation information on the airway geometry is desirable, especially considering the large changes in airflow regimes expected at different generations (18, 37, 60).
Besides the insight on lung and airway structure, CT also provides significant functional information, especially using multidetector CT (21, 22). The in vivo structural and functional information from medical imaging can be coupled with fluid and solid mechanics analysis to provide information on lobar ventilation, detailed airflow patterns, particle transport and deposition, and lung mechanics (8, 41, 44, 53, 87, 88). Significant advances have come from computational fluid dynamics (CFD) due to efficient numerical techniques and the steadily increasing computer power and have allowed the investigation of the detailed airflow fields in anatomically accurate, subject-specific geometries (7, 37, 42, 74, 90). However, the complexities of the respiratory flow, which features separation, recirculation, vortical structures, and laminar-to-turbulent transition, require thorough experimental validation. Experimental studies in realistic geometries are scarce, partly because laser flow imaging (the most used approach in experimental fluid dynamics) is complicated by the difficult optical access through the complex airway geometry. Therefore, investigations of this type, e.g., using particle image velocimetry, have been limited to the flow through one or two successive bifurcations in transparent airway casts (17, 71). On the other hand, magnetic resonance imaging (MRI), used in phase-contrast modality, allows reconstructing the three-dimensional velocity field without the need of optical access (12, 61). de Rochefort et al. (9) used this technique to image the velocity field along selected slices of the air volume up to the second branching generation. Banko et al. (2, 3) imaged the full 3-D flow field in the upper and central airways of a subject-specific 3-D-printed model applying both steady inhalation and oscillatory ventilation. These studies revealed strong vortical motions, with significant velocity components along planes perpendicular to the mean flow direction (so-called secondary flows). The latter were more intense than in idealized Weibel-type models at similar flow rates (29). A limitation in the studies of Banko et al. (2, 3) was represented by the simplistic boundary conditions applied at the distal branches, in that the five pulmonary lobes received equal flow rates. In general, past investigations that detailed the airflow field in subject-specific geometries rarely made a direct connection between those and the structural/anatomic features of the airway tree, a lack that we aim to help filling.
The present study focused on the structural and functional features of the human central airways, specifically in terms of bronchial geometry and airflow features during inhalation. We investigated the airway tree structure and lobar ventilation obtained by CT from a cohort of subjects with normal lung function and explored the detailed flow distribution for a representative case via in vitro phase-contrast MRI in a 3-D-printed model. Our specific goals were 1) to extend and complement the available data sets of in vivo morphometric measurements of the human airways, 2) to evaluate directly metrics of self-similarity, which are often used in models of the bronchial tree, and 3) to analyze the inspiratory flow field, specifically compared with functional properties of simplified models.
METHODS
Morphometry and lobar ventilation from CT scans.
This study was approved by the University of Minnesota Institutional Review Board (no. 1410E54644). We examined scans at full inspiration (total lung capacity) and at the end of a normal expiration (functional residual capacity) in 36 subjects within the cohort of the COPDGene study (67). The subjects were life-long nonsmokers with normal lung function and no history of lung disease. The mean subject age was 64 yr, ranging from 50 to 79 yr old. The 3-dimensional images were acquired using multidetector CT [see Regan et al. (67) for details on the imaging protocol]. The image resolution was dependent on both the slice thickness, which ranged from 0.5 to 0.75 mm, and the in-plane pixel size, which was determined by the field of view. The image voxel size was nearly isotropic and had a mean value of 0.3 mm3 (79).
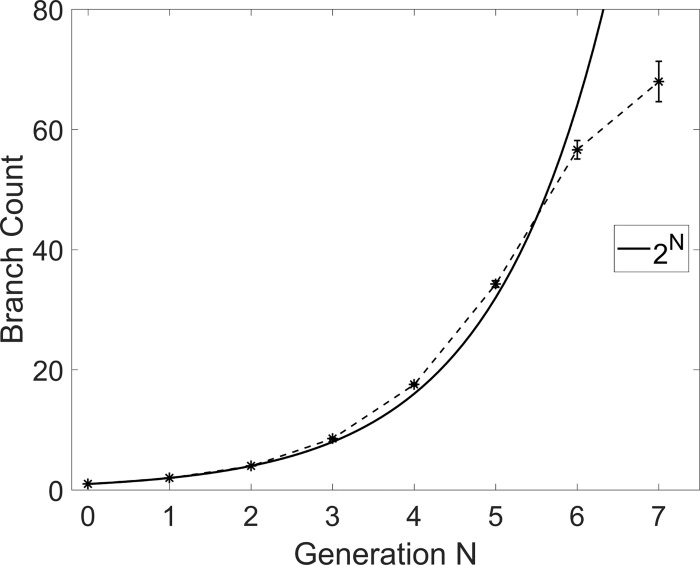
To extract the airway morphometry, the inspiratory CT scans were segmented and converted to stereolithography files, representing the surface of the bronchial tree (Fig. 1). The latter was smoothed globally using the weighted Laplacian smoothing algorithm in Magics (Materialise, Leuven, Belgium), which filtered spurious edges caused by limited spatial resolution. The software also allowed centerline extraction through a semiautomatic process, which typically results in deviations below 1 voxel from the true centerline, and compares favorably with other software platforms (68). The terminal branches were trimmed along planes nearly normal to the airway centerline. Depending on location and orientation, airways of diameter larger than ~0.6 mm were identified, corresponding to distal ends of bronchi up to the 5th to 15th generation, depending on the path. The present analysis extends down to the 7th generation. Figure 2 shows the number of reconstructed bronchial branches at each generation GN, where the subscript N indicates the generation number. We followed Weibel ordering and started labeling the airways from the trachea (G0) and continued downward, labeling branches as belonging to a further generation after each bifurcation. By comparison with the expected number of 2N branches at each generation (assuming dichotomous bifurcations), the count suggests that most branches down to the 6th generation were captured. The number of identified branches at the 7th generation was still substantial, although the large fraction of branches too small to be accurately reconstructed may affect the statistical results at that generation.
Fig. 1.
Segmentation process of CT images. A: single slice of a CT scan. B: segmented lobar volumes. C: segmented bronchial tree air volume. D: centerline calculated from bronchial tree segmentation. In B, the right upper lobe is dark green, the right middle lobe is orange, the right lower lobe is red, the left upper lobe is blue, and the left lower lobe is light green.
Fig. 2.
Branch count per generation, averaged over all cases. Error bars are reported in standard error (for a sample size of 36 subjects). The continuous line indicates the theoretical number of branches in a dichotomous tree.
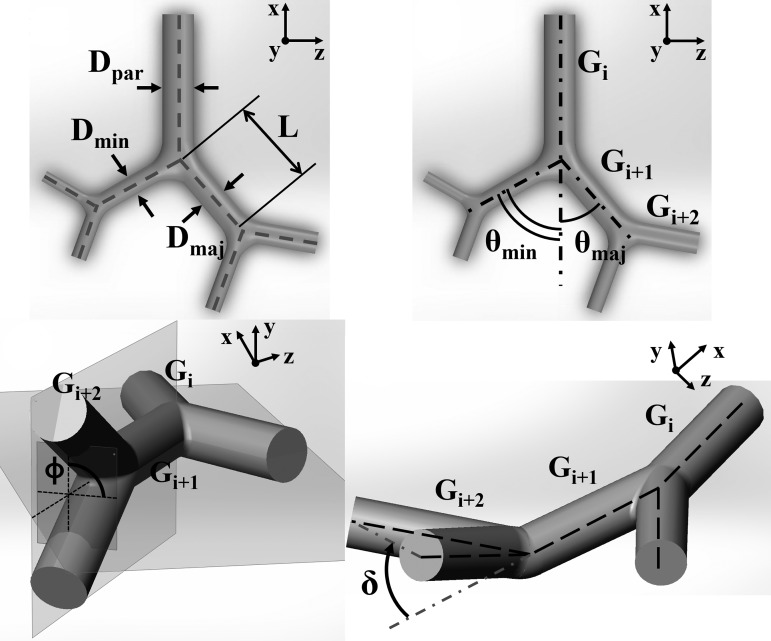
At each reconstructed airway branch and bifurcation, we considered the following geometric definitions (see Fig. 3). The airway length (L) is defined as the distance between the bifurcation points. The diameter (D) of each branch is the average over the central 50% of the branch length. At each bifurcation, the minor/major branch is defined as the branch with the smaller/larger diameter. The branching angle (θ) is defined as the angle between the forward directions of the parent and child branches. Forward directions for each branch are taken along straight lines joining successive bifurcation points. Compared with taking the local centerline tangent at the bifurcation point, this choice was found to be less sensitive to possible wiggling of the centerline. The rotation angle (ϕ) is defined as the angle between the plane containing the parent branch and its sibling and the plane containing the child branches. The nonplanarity angle (δ) is defined as the angle between the parent branch and the plane containing the child branches.
Fig. 3.
Schematics illustrating the various geometric parameters considered in the study.
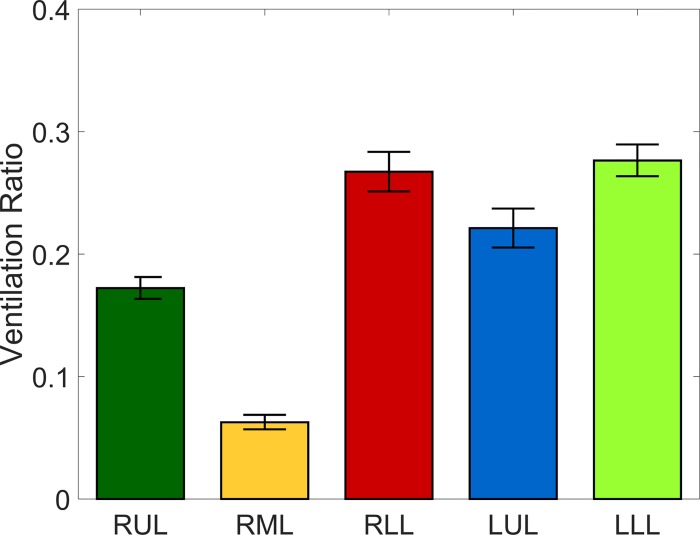
Inspiratory and expiratory scans were compared for each subject to assess the lobar ventilation needed to impose appropriate boundary conditions in the MRI flow measurements. For both sets of scans, the five lobes were segmented and separated by identifying fissure lines on the CT images, and the lobar ventilation was established by assessing lobar volume expansion, assuming the tissue volume was conserved (8, 88). Under this assumption, lobar volume expansion provides a measure of the amount of air inhaled by each lobe and therefore the fraction of the total inhaled volume (88). These fractions are to be used in the flow experiments to impose corresponding outflow boundary condition to each lobe (see section Inspiratory flow measurements by MRI velocimetry). Figure 4 shows the measured lobar ventilation distribution.
Fig. 4.
Lobar ventilation ratios, averaged over all cases. RUL, right upper lobe; RML, right middle lobe; RLL, right lower lobe; LUL, left upper lobe; LLL, left lower lobe. The bars corresponding to each lobe are colored following the color code in Fig. 1B. Error bars are reported in standard error (for a sample size of 36 subjects).
Metrics of self-similarity.
We evaluated the degree of airway self-similarity from both the structural and functional standpoints. Several existing structural and functional models and analysis of the airways and other biological trees are based on the assumption, implicit or explicit, that the diameter exponents m and n are equal (31, 36, 45). The present CT-based airway geometry data allowed us to calculate m by solving numerically Eq. 2 at each bifurcation. Moreover, the MRI-based flow data allowed us to evaluate n directly from Eq. 1.
The asymmetry at the dichotomous bifurcations, and the consequent flow split, has also been regarded as systematic. Specifically, one can define the flow-dividing ratio (r) as the ratio of flow in the child branch receiving the smaller flow to that in the parent branch:
| (3) |
from which it follows Qmaj = (1 − r)Qpar. Assuming a constant value of r throughout the branch results in a log-normal distribution of the flow rate at the terminal branches of the tree (15, 65). As with the diameter exponent in Eq. 1, to date, it has not been possible to measure r directly, and this has rather been deduced from airway morphometry and assuming m = n, i.e.:
| (4) |
Here, we used the flow rates directly measured by MRI to calculate r from Eq. 3.
To explore the fractal nature of the bronchial tree, we calculated the box-counting dimension (db) from the volumetric reconstruction of the airways of each subject. An isotropic 3-D Cartesian grid is superimposed to the segmented bronchial structure and, for a given size (Δ) of the grid, the number of cubical boxes [NB(Δ)] needed to cover the whole structure is counted. In the case of a pure fractal set of dimension df, the number of boxes would follow a power law . In real systems, this relation only holds in a restricted range of scales between a large- and a small-scale cutoff. We defined a local exponent as the logarithmic slope:
| (5) |
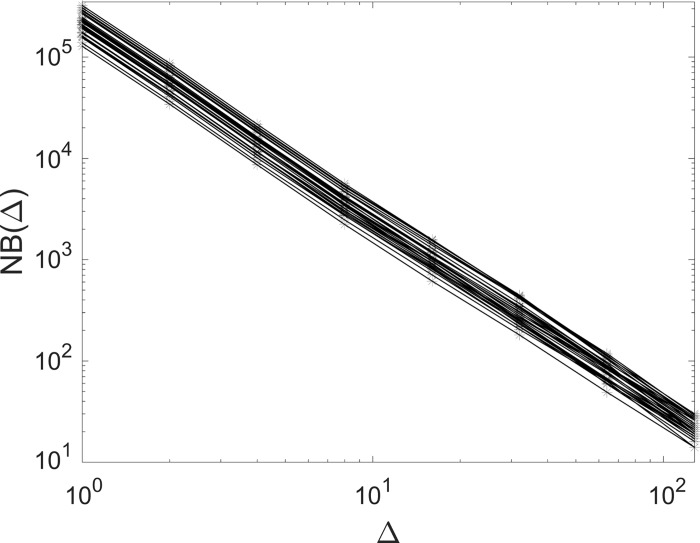
and calculated the box-counting dimension as a fit over the range for which such slope was approximately constant. Here, the most refined grid we used had 6253 voxels; denser grids have boxes smaller than the smallest reconstructed airways and therefore do not extend the scaling range. Figure 5 shows the box count [NB(Δ)] as a function of box size (Δ) for a subset of the considered subjects, indicating strong self-similarity over >1 decade.
Fig. 5.
Three-dimensional box-counting of the airway tree: log-log plot of the box size (Δ) vs. the box count (NB) for a subset of the considered subjects. Here, Δ has units of voxels.
Inspiratory flow measurements by MRI velocimetry.
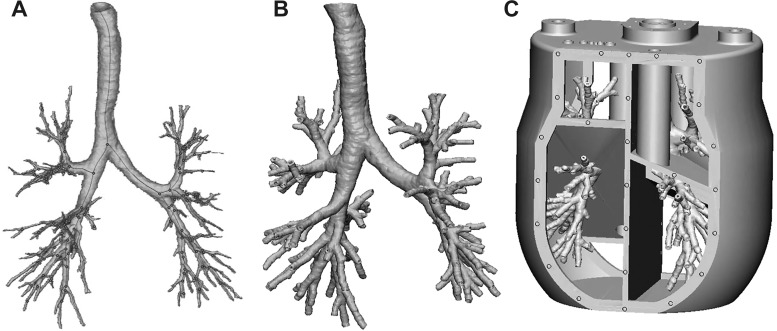
To assess the details of the inspiratory flow field through the bronchial tree, the airway tree of one subject case was used to build a 0.85:1 physical model, which was then employed for MRI velocimetry. The selected subject was representative of the cohort in that it had morphometric features close to the mean of the distribution for all geometric parameters. A 2.5-mm-thick solid was created from the inspiratory airway surface using the software 3-matic (Materialise). A five-cavity enclosure was then built around it using the software SolidWorks (Mountain View, CA), creating a one-piece model (Fig. 6). The five cavities were used to collect the flow from the terminal bronchi of each lobe, in a similar fashion as in Banko et al. (2, 3). The model was 3-D-printed at the W. M. Keck Center (University of Texas at El Paso, El Paso, TX) using WaterShed XC 11122. The high-resolution print (25-µm layer thickness) guaranteed that the inner walls of the model were hydrodynamically smooth.
Fig. 6.
A: segmented bronchial tree air volume. B: thickened and hollowed bronchial tree. C: computer-aided design rendering of the flow model to be 3-D-printed.
Water was used as the working fluid, with the addition of copper sulfate at 0.06 mol/l to maximize the MRI signal without changing the fluid properties. Although MRI velocimetry has been performed with gases such as 3He and SF6 (9, 11), water offers much higher signal than unpolarized gas at much shorter scan times, whereas hyperpolarized gases can become unpolarized during use (11). The flow in a rigid airway model is completely characterized by the Reynolds and Womersley numbers (30); in the present case, in which steady inhalation is considered, only the former needs to be matched. Therefore, dynamic similarity with airflow is achieved by adjusting the water flow velocity to compensate for its lower kinematic viscosity.
The MRI experiments were carried out at the University of Minnesota Center for Magnetic Resonance Research, and the procedure was similar to what was described in our recent study of the flow in a Weibel-type model (29). The flow was driven by a centrifugal pump (TE-6-MD-SC; Little Giant) that circulated the fluid from a reservoir through the model and back to the reservoir, which were connected via plastic tubing 2.5 cm in diameter. The volume flow rate was regulated by a digital flow controller (LCR-5LPM-D; Alicat Scientific) with ~2% uncertainty. The flow was carried through tubing with a diameter of 25 mm and entered the trachea through a separately 3-D-printed piece that smoothly connected the two, preventing any geometric step from producing inlet flow disturbances. Each plenum had a separate outlet with needle valves to adjust their respective return flow rates. These were measured with a Transonic flow meter (Transonic TS410 Tubing Module and Transonic ME-6PXL clamp-on flow probe) and set to match the subject-specific lobar ventilation obtained by the inspiratory and expiratory CT scans. These lobar ventilation fractions are very similar to the cohort-averaged values reported in Fig. 4. All components and bolts were made of plastic to be fully MRI-compatible. The inlet flow rate was 1.6 l/min, which is equivalent (for the same Reynolds number) to ~22.5 l/min air. The inlet Reynolds number at the trachea, defined as:
| (6) |
was ~1,750, typical of normal breathing conditions (60). Here, U0 and D0 are, respectively, the bulk velocity and the hydraulic diameter at the uppermost reconstructed end of the trachea, and ν is the fluid kinematic viscosity. A 3-T Siemens whole body scanner was used with the airway model inserted in a transmit-and-receive radio-frequency coil commonly used for human-head imaging. Velocity data were obtained using the method described by Elkins and Alley (11) with the signaling and data acquisition sequence from Markl et al. (48). The main scan parameters were repetition time of 34.4 ms, echo time of 8.6 ms, 35° flip angle, and velocity encoding value of 600 mm/s. Three-dimensional velocities were obtained on a uniform Cartesian grid at a resolution of 0.6 mm in all spatial directions. Four successive scans were acquired and averaged to increase accuracy. The expected uncertainty was calculated following Pelc et al. (62) and ranged between 4.8 and 6.3% of U0 depending on the location.
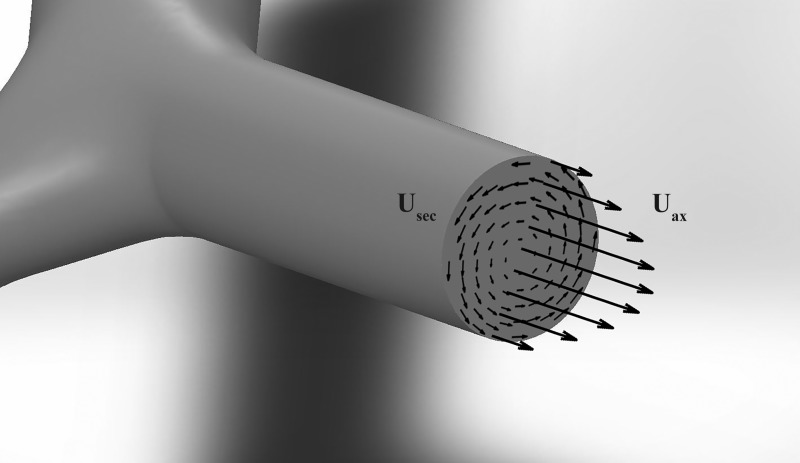
Our flow analysis was focused on two main quantities: the volumetric flow rate through each branch and the magnitude of the secondary flows (defined by the velocity components perpendicular to the branch axis). Considering a branch cross-section of area (A) perpendicular to the streamwise flow direction (a; illustrated in Fig. 7), the volumetric flow rate is defined as:
| (7) |
where Uax is the velocity component in direction a, whereas Usec lies on the plane of the cross-section. A rigorous definition of the axial direction is necessary. In simple tubular networks, this is identical to the geometric axis of each branch, which coincides with the airway centerline. In realistic bronchial trees, the geometric centerline may not be exactly aligned with the mean flow direction in the branch due to the complexity of the airway morphology and the flow trajectory. Therefore, we applied conservation of mass to establish the axial direction as the direction along which the flow is aligned. Specifically, for each branch, we ran an optimization routine to find the cross-section orientation that minimizes the average in-plane velocity (which at rigor should be 0). The local centerline direction was adopted as first guess, and the cross-section orientation was varied incrementally until the residual in-plane velocity was below 1% of the out-of-plane component. Finally, to calculate Q and Usec, multiple cross-sections spaced by one voxel size (0.6 mm) were considered and averaged over the central 50% of the length of each branch.
Fig. 7.
Diagram illustrating branch-axial velocity (Uax) and the cross-sectional plane velocity (Usec) in a branch.
RESULTS
Airway morphometry.
The tree-averaged morphometric results are summarized in Table 1. In the following, we present each of them in some detail.
Table 1.
Morphometric parameter results
| Parameter | Mean ± SD |
|---|---|
| Number of reconstructed branches per subject | 192 ± 31 |
| D/D0 | 0.26 ± 0.04 |
| L/D0 | 0.76 ± 0.08 |
| h | 0.79 ± 0.02 |
| hmin | 0.73 ± 0.02 |
| hmaj | 0.85 ± 0.02 |
| Dmin/Dmaj | 0.86 ± 0.01 |
| Lmin/Lmaj | 2.0 ± 0.24 |
| L/D | 3.4 ± 0.3 |
| (L/D)min | 4.3 ± 0.4 |
| (L/D)maj | 2.8 ± 0.4 |
| θ, ° | 33 ± 2 |
| θmin, ° | 36 ± 2 |
| θmaj, ° | 31 ± 2 |
| ϕ, ° | 54 ± 2 |
| δ, ° | 7.8 ± 0.8 |
D, branch diameter; L, branch length; h, child-to-parent diameter ratio; θ, branching angle, ϕ, rotation angle, δ, nonplanarity angle.
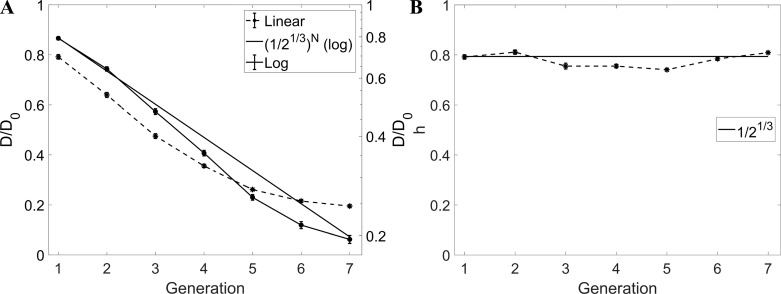
Figure 8 shows the airway diameter (normalized by the value at the trachea D0) as a function of the branching generation. In this and in the following plots, the error bars represent ± standard error (for all branches at each generation and for all patients), whereas in Table 1 and in the main text we report means ± standard deviation to highlight the statistical spread. The semilog plot in Fig. 8A highlights the expected exponential decay with branching generation (83), which is the consequence of an approximately constant value of the child-to-parent diameter ratio (h). The theoretical trend obtained assuming h = 0.51/3 ≈ 0.79 (81) is also indicated, yielding excellent agreement. This is confirmed also by explicitly plotting h as function of generations. The overall average of 0.79 ± 0.02 is consistent with published values (52, 54, 73). The homothety ratio appears to be remarkably consistent along the conducting airways, in contrast with the increasing trend found by Montaudon et al. (54).
Fig. 8.
A: D/D0 vs. generation. B: homothety ratio (h) vs. generation. Error bars are reported in standard error. In A and B, the straight continuous line indicates the theoretical trend with h = 2−1/3. In A, D/D0 is plotted in both linear scale (dashed line, left axis) and logarithmic scale (continuous line, right axis).
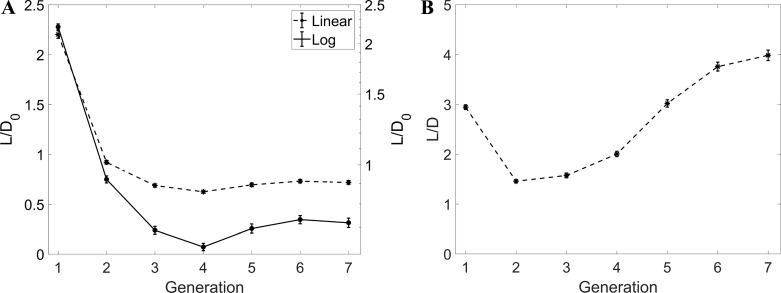
The evolution of the normalized airway length L/D0 along successive generations is plotted in Fig. 9A. After a quick drop of the length of the bronchi in the first three generations, the values reach an apparent plateau, although this cannot be firmly concluded from the present data limited to G7. When considering the branch aspect ratio L/D (Fig. 9B), large fluctuations are found. In addition, the mean value over all branches is significantly larger than the value of ~3 generally quoted (52, 64, 69, 81), but the standard deviation is very large and consistent with the measurements of Sauret et al. (69) and Tawhai et al. (73). Despite the scatter, a markedly nonmonotonic trend is visible, with the branches becoming shorter (relative to their diameter) at G2 and G3 and recovering length deeper in the tree, where the relatively long and numerous branches at G5–G7 increase substantially the mean L/D value. A similar trend was visible in the original data of Weibel (81), with a minimum of L/D for G3, but to our best knowledge it has not been reported since then. In reanalyzing Raabe's data, Phillips and Kaye (64) did remark that, with decreasing diameter, the airway length decreased less than what proportionality would imply.
Fig. 9.
A: L/D0 vs. generation. B: L/D vs. generation. Error bars are reported in standard error. Notice that, in A, L/D0 is plotted in both linear (left axis) and logarithmic (right axis) scales.
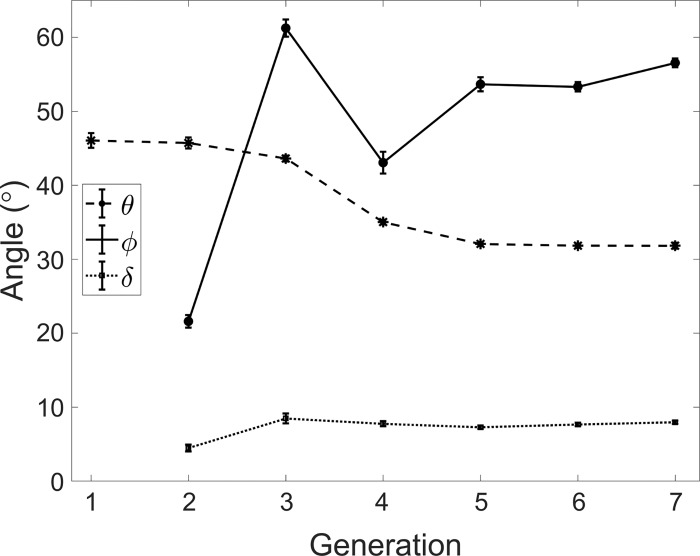
Figure 10 plots the branching angle (θ), the rotation angle (ϕ), and the nonplanarity angle (δ) as a function of the generation number. The average value of θ = 33 ± 2° is consistent with the published range (23, 63, 69, 73). Previous measurements based on casts showed contradictory trends in terms of variation of the branching angle along the airway tree, with Phalen et al. (63) and Horsfield and Cumming (24) reporting decreasing and increasing θ with deeper generations, respectively. As previously pointed out, obtaining accurate measurements of airway angles from casts is a complicated operation (75). Here, we found that θ, over the considered range of generations, followed a decreasing trend with more distal airways. The rotation angle (ϕ) is typically assumed equal to 90° in analytical and computational models (10, 36, 49), according to the large angles reported by morphometric reports from casts (22a). The in vivo measurements of Sauret et al. (69) and Tawhai et al. (73) found average values of 79 and 76°, respectively; both considered only one subject. We found a significantly lower average of ϕ = 54 ± 2°. The rotation angle was, in fact, much smaller for the bifurcations leading to the lobar bronchi (consistent with the fact that lung imaging of coronal sections typically capture several proximal branches), and it was then ~55° in the further generations up to G7. The nonplanarity angle (δ), which is usually assumed null, was measured here for the first time. We confirmed that this angle takes small values, according to physiological principles of wiring cost minimization in biological trees (34).
Fig. 10.
Branching angle (θ), rotation angle (ϕ), and the nonplanarity angle (δ) vs. generation. Error bars are reported in standard error.
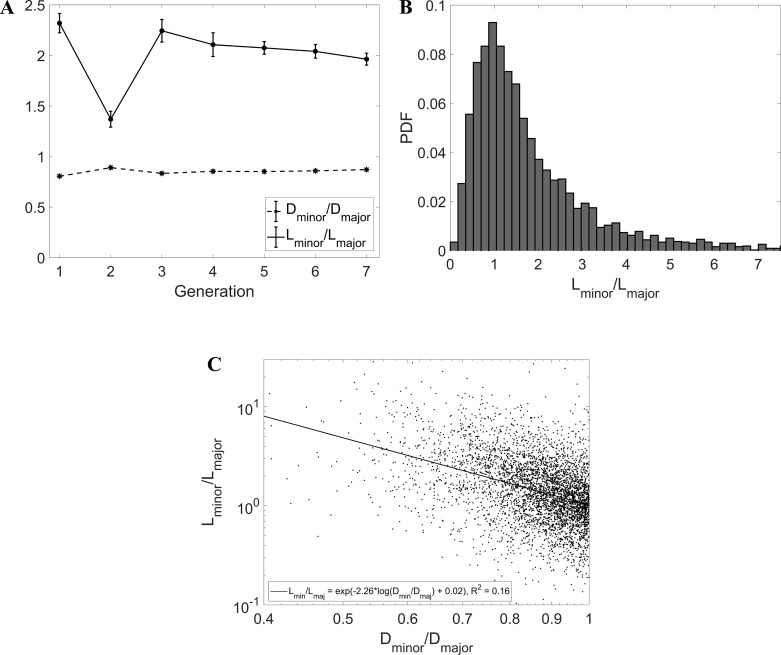
Previous morphometric studies indicated significant asymmetry in the bronchial tree (24). Here, we addressed the differences between sibling airways in terms of diameter, length, and branching angle. Figure 11A displays the ratio Dmin/Dmaj, bound to be smaller than 1. The average across all reconstructed generations was 0.86 ± 0.01, in the range of published data (63, 73, 81), and the ratio was also fairly consistent across the different generations. Consequently, the values of h calculated for the minor and major child branch were also consistent along the airway tree and had averages of 0.73 ± 0.02 and 0.85 ± 0.02, respectively; these, too, were within the published ranges (64, 73). On the other hand, the ratio Lmin/Lmaj (the length of the smaller-diameter child divided by the length of the larger-diameter child) showed a surprising behavior. The latter appeared to be consistently larger than unity, with an average of 2.0 ± 0.24. The fact that larger siblings had shorter length is seemingly against the idea of an L/D proportion, which is instead widely accepted. However, a closer look at previously reported data shows that our finding was consistent with the acknowledged asymmetry of the bronchial tree. Indeed, the ratio L/D for major child branches was consistently reported to be smaller than L/D for minor branches (64, 73). For example, Tawhai et al. (73) reported mean values of (L/D)maj = 2.48 and (L/D)min = 3.63. Since they also reported Dmin/Dmaj = 0.85, one deduces from their data that Lmin > Lmaj. The distribution of Lmin/Lmaj has a log-normal behavior (Fig. 11B): although the most likely configuration features siblings of comparable length, instances of one child branch being several times longer than the other are not uncommon. The fact that the larger sibling tends to be systematically shorter is confirmed by the scatterplot in Fig. 11C, which indicates a negative correlation between Dmin/Dmaj and Lmin/Lmaj.
Fig. 11.
A: Dmin/Dmaj and Lmin/Lmaj vs. generation. B: probability distribution function (PDF) of Lmin/Lmaj. C: scatterplot of Dmin/Dmaj vs. Lmin/Lmaj with linear least-squares fit line and showing fit equation and r2 coefficient (P < 0.001). Error bars are reported in standard error.
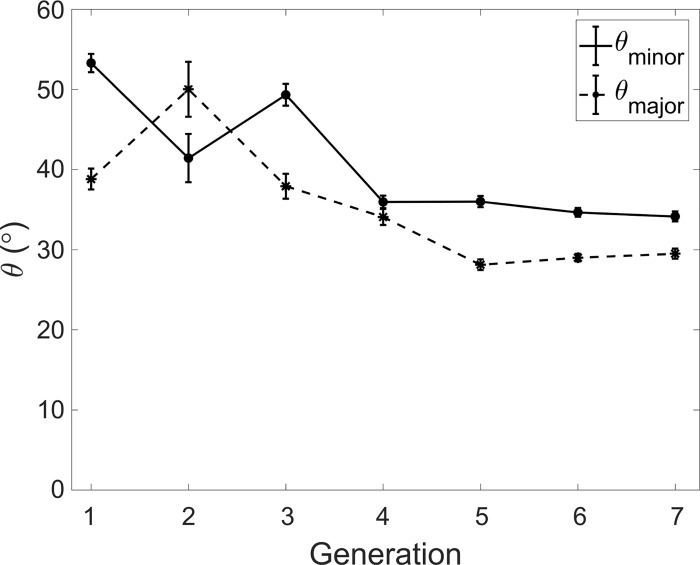
In Fig. 12, we show the branching angles made by the major and minor child airways at different generations. Except for G2, the larger siblings appear to make a significantly smaller angle than the smaller ones. Phalen et al. (63) reported that branching angles in humans were fairly symmetric compared with other animals. However, their analysis (based on Raabe's data) does show consistently larger angles, by ≥10°, for minor branches than for major branches. We found that in 49% of sibling pairs, the minor sibling angle was ≥10° larger than the major sibling angle.
Fig. 12.
Branching angles θmin and θmaj vs. generation. Error bars are reported in standard error.
Diameter exponent and flow-splitting ratio.
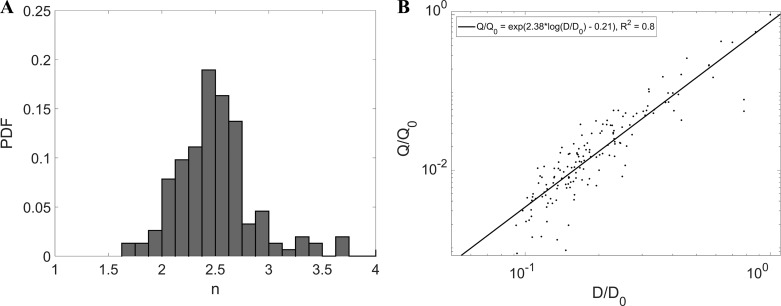
In Fig. 13, we directly verify the validity of Q = CDn using the CT-reconstructed airway diameters and the respective flow rates measured by MRI velocimetry, showing the probability distribution of n. Both flow rate and diameter were normalized by their value at the trachea, Q0 and D0, respectively. A best fit in a log-log scatterplot well represents the data, supporting the assumption that n is fairly constant along the airway tree. The least-squares fit value of 2.36 (close to the mathematical mean of 2.4) is significantly smaller than what was previously reported [e.g., 2.9 by Horsfield and Thurlbeck (26) and 3.0 by Kitaoka and Suki (35)]. Previously reported values, however, have always been for the exponent m in Eq. 2 rather than for n.
Fig. 13.
A: probability distribution function of n. B: log-log scatterplot of D/D0 vs. Q/Q0 superimposed with linear least-squares fit line and showing fit equation and r2 coefficient (P < 0.001).
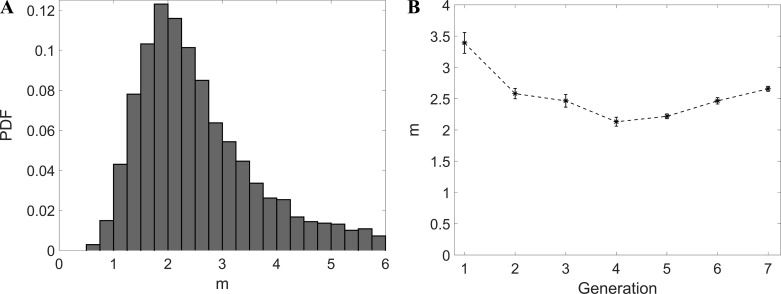
In Fig. 14A, we show the probability distribution of m calculated by applying Eq. 3 to the reconstructed bronchial trees. This resembles what is reported by Horsfield and Thurlbeck (26) and Kitaoka and Suki (Ref. 35; using Raabe's data) and appears to follow a log-normal behavior. Figure 14B depicts the variation of m with the generation number and suggests a decreasing trend along the airway tree. Since Re decreases at each generation, this would appear to contradict the general idea that the exponent becomes lower for fully laminar flow (26, 76). However, one should keep in mind that m is only an approximation for n. Also, the canonical values of 2.333 for turbulent and 3 for laminar flow assume fully developed regime, which is never achieved in the airways, as we also discuss in the next section.
Fig. 14.
A: probability distribution function of m. B: m vs. generation. Error bars are reported in standard error.
Knowing the flow rate at each bifurcation, we can directly calculate the flow-dividing ratio (r; Eq. 3), which is an important parameter in asymmetric airway flow models (35, 36, 45). The average value of r measured by MRI is 0.32, but there is significant scatter and no clear trend with generation number. This is consistent with the assumption of Kitaoka and Suki (35), who proposed a tree model with r uniformly distributed between 0.2 and 0.5. On the other hand, Majumdar et al. (45) assumed constant values for r across their tree model. If one uses Eq. 4 to calculate an average value, n = 2.4 and hmin = Dmin/Dpar = 0.73 (see Table 1) yield r = 0.47. Assuming the usual diameter exponent value of n = 3 instead yields r = 0.39.
Fractal dimension.
We evaluated the box-counting dimension in two ways. First, we considered the least-squares linear fit in the log-log plot (Fig. 5) in the range Δ = 2 − 60. Second, we calculated the local slope from Eq. 5 and took its average value over the same range. The two methods returned box-counting dimension 1.89 and 1.9, respectively. To assess the importance of evaluating the fractal dimension on the actual 3-D geometry (as opposed to a planar image of it), we projected the geometry onto a coronal plane and repeated the box count in 2-D using up to 6252 square elements. This leads to a box-counting dimension of 1.8; the mismatch with the 3-D value underlines the need for performing a full volumetric analysis for accurately capturing the fractal dimension of the highly three-dimensional airway tree.
Kamiya and Takahashi (31) reasoned that the fractal dimension df (calculated as the box-counting dimension or by similar techniques based on the probability distributions of branch sizes) is related to the (geometric) diameter exponent m by:
| (8) |
where α is the exponent in a power-law relationship between the branch length and the diameter (31, 72):
| (9) |
α Is typically reported to be ~1, consistent with the fact that several airway morphology studies showed fairly constant L/D ratios (66, 81). Assuming α = 1, the values for the fractal dimension and the diameter exponent appear consistent with Eq. 8.
Secondary flows.
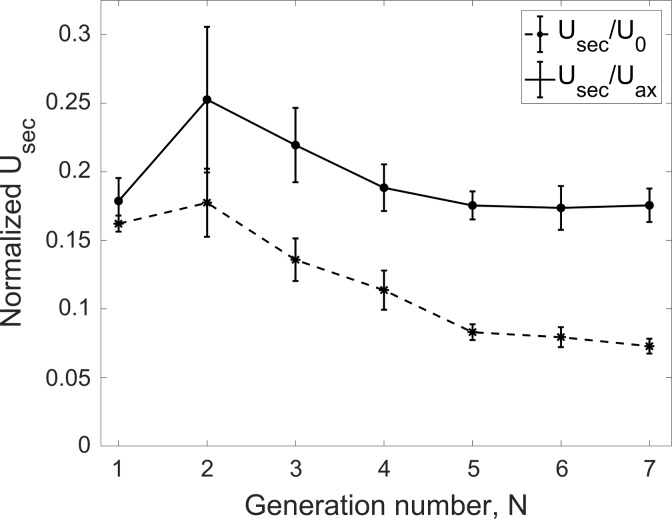
The flow rate gives a measure of the axial flow velocity in each branch. A complementary metric describing the transport in the airways is represented by the secondary flows, for which intensity is shown in Fig. 15. This is evaluated as the magnitude of the secondary velocity component (Usec; see Fig. 4) along each branch cross-section and averaging over the central 50% of the branch length, similar to the flow rate calculation. When normalizing by inflow velocity at the trachea, U0, the secondary flows appear to build up in the first couple of bifurcations and then steadily decrease through the bronchial tree due to the general reduction of the velocity magnitude. On the other hand, when normalizing by the local bulk (i.e., cross-section averaged) axial velocity, Uax, the secondary flow strength peaks at 25% and remains steadily >17% of the streamwise velocity component. This is larger than the secondary flow strength found in idealized airway models. For example, Isabey and Chang (28) found that the secondary flow magnitude never exceeded 16% of the axial velocity in a Horsfield-type model, whereas according to Fresconi and Prasad (14) it did not exceed 10–20% in a Weibel-type model.
Fig. 15.
Secondary velocity magnitude (Usec) normalized by the bulk tracheal velocity (U0) and the local branch bulk velocity (Uax) vs. generation. Error bars are reported in standard error.
DISCUSSION
Cast-based morphometric models of the human airways such as Weibel's and Horsfield's have been invaluable to the lung physiology community. With the availability of accurate in vivo measurements of airway geometry via medical imaging (54, 69), it is natural to incorporate those in more realistic representations of the bronchial tree (73). Beyond the purely anatomic measurements, the transition from the structural to the functional information has been usually based on simplistic assumptions on the nature of the flow, for example, fully laminar and developed (Poiseuille) regime (31, 36). With the advent of advanced computational methods and volumetric velocimetry techniques, it has become possible to reconstruct the full flow field in realistic models across many generations (3, 7, 43, 90), enabling a more accurate definition of the structure-function relationship. In the present study, we used high-resolution lung CT scans of 36 healthy subjects to determine the anatomic features of their airway tree. We then created a physical model of one subject's tree and used it to measure the detailed flow field throughout via phase-contrast MRI while imposing steady inspiratory flow rate and patient-specific lobar ventilation. We have therefore been able to evaluate classic morphometric features from the cohort as well as to test widely used structure-function relationships for the central airways. Although we (3) had previously used MRI velocimetry to explore the flow pattern in subject-specific airway geometry, this is the first time that this technique is used to explore respiratory physiology and to probe structure-function relationships.
Previous morphometric in vivo studies considered only one subject (69, 73) or measured only selected quantities such as lumen area (54). From the present cohort, we have reconstructed >3,000 branches extending over 7 bronchial generations and measured branch diameter, length, bifurcation angle, rotation angle, and bifurcation planarity along with several measures of bifurcation asymmetry. We find that several parameters of proportionality show remarkable self-similarity over the investigated generations, whereas others vary significantly along the tree. Specifically, the homothety ratio is fairly constant and close to the optimal ratio of 0.79 (81). The length-to-diameter ratio instead varies significantly, being smaller than the usually quoted value of 3 for generations G2 and G3, and growing well above such value for further generations. This confirms previous observations that the airway lengths do not get uniformly smaller with further generations at the same pace as diameters do (40, 52). The change in branch length-to-diameter ratio could have significant impact on the airway resistance. According to Pedley (60), for fixed flow rate and bulk velocity, the pressure drop due to viscous dissipation is proportional to (Re·L/D)1/2 [a relationship shown to be at least qualitatively correct by numerical simulations in idealized models (6)]. Our results show that L/D tends to be significantly below the average in upper generations where Re is higher and vice versa in deeper generations. Therefore, it is possible that realistic bronchial trees (having long airways deeper in the bronchi, where the pressure drop per unit length is smaller) offer lower resistance than equivalent trees of constant L/D = 3. We remark, however, that this argument does not account for other geometric factors that may affect airway resistance (such as the precise bifurcation geometry) nor for the effect of unsteadiness/turbulence at higher Re. The branching angle shows a steadily decreasing trend from ~45° at G1 to 30° at G6 and G7. The rotation angle is significantly smaller than what was previously reported, hovering around 55°. The bifurcations are confirmed to be planar and strongly asymmetric: the minor branch is typically ~20% smaller in diameter than its major sibling but also significantly longer and making a somewhat larger angle with the direction of the parent branch. Therefore, although human airways are more symmetric compared with other mammals (63), the present data suggest (as also indicated by several past studies) that systematic asymmetries need to be incorporated in realistic lung models beyond the simple difference of siblings’ diameter. In particular, to our best knowledge, the fact that minor child branches are much longer than major ones had not been reported before; this possibly went unnoticed due to the large variability of L and the limited number of samples considered in past studies. Indeed, most previous morphological reports with relatively large cohorts focused on airway lumen rather than length (54, 79). This geometric feature of the lungs might have far-reaching consequences, potentially impacting the unevenness in flow distribution due to differences in resistance. This awaits to be explored by functional airway models.
Despite the patently fractal nature of the airway structure, direct measurements of the fractal dimension (df) of the airway tree have been sparse and mostly based on cumulative measures of airway branch length, which are strongly dependent on the branch ordering method (57). The difficulty stems from applying to real systems definitions of df, which are originally meant to describe mathematical constructs. For vascular systems, which are routinely imaged to great detail by in vivo CT using contrast agents, the common approach has been the box-counting method. Using this technique, several groups reported df ~1.7 for the retina blood vessels (50), and Boxt et al. (5) measured df = 1.62 for the pulmonary circulation. This approach was followed also by Boser et al. (4) to measure df = 1.83 in the airway tree by analyzing 2-D pictures of casts. We performed the first in vivo estimate of the airway fractal dimension using the box-counting method on the fully 3-D-reconstructed tree and found a fractal dimension between 1.88 and 1.9. This suggests that, over the scaling range available with the present resolution, the bronchial tree appears to be more space-filling than typical vascular beds. Moreover, we pointed out how considering only a 2-D image of the highly three-dimensional bronchial tree might lead to a somewhat misestimated value.
Another important metric of self-similarity is the diameter exponent n in the flow-diameter relation Q ∝ Dn, which is often used as a foundation to construct structural and functional tree models (31, 35, 36). Besides the CT-based diameter, we have exploited the information on the flow rate at each branch obtained by in vitro MRI velocimetry to evaluate such exponent, yielding n = 2.36. Previous estimates have all evaluated the exponent indirectly, using solely the geometry, yielding values closer to n = 3, i.e., the optimum value for Poiseuille flow (14). One could deduce that, over the considered portion of the tree, the flow through the airways is rather turbulent than laminar [n = 2.333 being the optimum for fully developed turbulent flows (58)]. However, we do not draw such a conclusion. The Reynolds number (which we directly calculate using the axial velocity at each branch obtained by MRI) rapidly decreases at each generation because of the flow split among successive bifurcations and the reduction in airway diameter. Here, at the second generation, it is already Re < 1,000. Therefore, even if unsteadiness may ensue at the upper generations, turbulence is unlikely to be fully developed in the considered regime. Rather, one should keep in mind that both n = 2.333 and n = 3 represent optimal conditions obtained for fully developed flows, a situation that is never achieved in the relatively short airway branches. The bronchi always see developing flows, with boundary layers growing over their entire length (60). Moreover, the streamlines do not describe a “parallel flow” (such as the Poiseuille flow) but have a strongly spiraling motion produced by the intense secondary velocities. Therefore, although the flow might be turbulent or at least unsteady in the first few generations depending on the inhalation flow rate (18, 60), even at laminar regimes the inspiratory flow is not well-represented by the Poiseuille solution; therefore, a departure from n = 3 is expected, and the relatively strong secondary flows contribute to such departure, leading to an n exponent similar to that of turbulent flow. The magnitude of the secondary flow motions is found to be consistently >17% of (and locally it can be as high as) the local axial velocity, significantly more intense than in canonical (Weibel-type or Horsfield-type) models (14, 28). Importantly, the relative strength of the secondary flow is maintained deep in the bronchial tree. This may have far-reaching consequences for, e.g., the transport of therapeutic and harmful particles, which are highly responsive to vortical motion (37). To date, secondary flows have not been directly incorporated in analytical models of lung structure and function (13, 36, 45). This class of models typically assumes a flow-diameter relationship and/or straight parallel flow in each branch. Given the relative strength of the secondary flows found in realistic geometries and the fact that these appear to persist up to at least the 7th generation of branching, we argue that similar models could benefit from incorporating these motions in the flow representation, especially because these motions affect not only pressure drop, but also gas mixing and particle transport (14, 39, 90). The practical implementation (e.g., through empirical corrections) is beyond the scope of this work, but further research in this area is warranted.
The present study had several limitations. The number of considered subjects, although the largest to date in morphometric studies of this kind, was limited; future studies on larger cohorts should provide more accurate mean values for the geometric parameters. The resolution of the CT scans we used is state of the art but still limited in terms of the depth of the generations we could resolve. Indeed, the precise values of our G6 and G7 estimates were likely affected by the fact that not all branches at those generations could be captured. The respiratory flow investigation has focused solely on steady inspiration. Several previous studies show that, at low to moderate respiration frequency, the effects of the time-dependent oscillation cycle are indeed minor (14, 89). In particular, the flow fields in steady and unsteady inspiration agree fairly well except during the deceleration phase and near flow reversal (37). Such a regime, in which the viscous forces prevail over the unsteady inertial forces, is characteristic of quiet breathing. Also, deep inhalation maneuvers associated with aerosol drug delivery are typically considered quasisteady as far as the central airways are concerned. In these conditions, we therefore expect features such as the secondary motions to be well-reproduced by steady inspiratory experiments. On the other hand, under faster-paced breathing patterns typical of high-frequency ventilation and exercising, the oscillatory flow in the inhalation phase is qualitatively different from steady inhalation (2, 17), and therefore the present results cannot be extended to those regimes. The MRI flow measurements were performed on a rigid model, not accounting for any airway compliance. This is common practice in both experimental and numerical studies (37), in keeping with the assumption that the variations of airway length and diameter throughout the first few generations are not large. Computational studies including fluid-structure interaction indicate that the effect on flow distribution and intensity of secondary flow is moderate (78). Still, wall motion does have an effect on the flow pattern and even more on the wall shear stresses (86), and its influence shall be investigated more in depth in future functional models. This, however, remains a challenge due to many unknowns on the mechanical properties of the airway walls (32), which can possibly be addressed with input boundary conditions from 4-D CT imaging (87). The airway model did not include the upper airways, which are expected to have a significant effect on the flow features downstream (43). Our focus was on the bronchial tree, and the present approach allowed us to isolate the fluid dynamics in it. Accurate reconstructions of the mouth-throat geometry are much less common than central airways (typically obtained by CT) due to the sizeable level of radiation to the head in those types of scans. It is therefore important to investigate structure-function relations that can be applied to the airway geometry directly available from common chest scans. Moreover, the effect of the upper airways would mainly affect G1 and G2, whereas most of our results (including the flow-diameter relation and the relative strength of the secondary flows) apply across the reconstructed generations. MRI measurements have been carried out for only one subject, limiting the statistical power of the findings. The process of generating deep airway models and imposing the appropriate lobar ventilation is elaborate, and the MRI flow measurements are involved. The reported values of secondary flow intensity are indeed consistent with those previously obtained for a different subject using similar methods (3), lending credibility to the present conclusions. In the future, opportunely validated CFD solvers can be used to extend the present study to a much larger cohort. Although current CFD allows high-fidelity reconstruction of the 3-D airflow in both idealized and realistic airway geometries, this has rarely been used to explore fundamental structure-function relationships (51). Indeed, once the structural and functional parameters we have investigated (as well as others) are established for healthy lungs, image-based measurements and simulations can be leveraged for timely and noninvasive diagnosis of airways disease and assessment of the disease progression. The morphometric data used for this study are available online at https://conservancy.umn.edu/handle/11299/190800.
GRANTS
Funding for this work was provided by the National Science Foundation (CBET-1453538) and the National Heart, Lung, and Blood Institute (Grant R21-HL-129906). COPDGene was supported by Awards R01-HL-089897 and R01-HL-089856 from the National Heart, Lung, and Blood Institute and by the COPD Foundation through contributions made to an Industry Advisory Board composed of AstraZeneca, Boehringer Ingelheim, GlaxoSmithKline, Novartis, Pfizer, Siemens, and Sunovion.
DISCLOSURES
No conflicts of interest, financial or otherwise, are declared by the authors.
AUTHOR CONTRIBUTIONS
C.H.W. and F.C. conceived and designed research; T.V.d.M. and F.C. performed experiments; T.V.d.M. analyzed data; T.V.d.M., C.H.W., and F.C. interpreted results of experiments; T.V.d.M. prepared figures; T.V.d.M. and F.C. drafted manuscript; T.V.d.M., C.H.W., and F.C. edited and revised manuscript; F.C. approved final version of manuscript.
ACKNOWLEDGMENTS
We gratefully acknowledge the access to the COPDGene database. We thank Ute Goerke, Sahar Jalal, Andras Nemes, and Omid Amili for help during the MRI measurements and discussion in the analysis of the results.
REFERENCES
- 1.Aysola RS, Hoffman EA, Gierada D, Wenzel S, Cook-Granroth J, Tarsi J, Zheng J, Schechtman KB, Ramkumar TP, Cochran R, Xueping E, Christie C, Newell J, Fain S, Altes TA, Castro M. Airway remodeling measured by multidetector CT is increased in severe asthma and correlates with pathology. Chest 134: 1183–1191, 2008. doi: 10.1378/chest.07-2779. [DOI] [PMC free article] [PubMed] [Google Scholar]
- 2.Banko AJ, Coletti F, Elkins CJ, Eaton JK. Oscillatory flow in the human airways from the mouth through several bronchial generations. Int J Heat Fluid Flow 61: 45–57, 2016. doi: 10.1016/j.ijheatfluidflow.2016.04.006. [DOI] [Google Scholar]
- 3.Banko AJ, Coletti F, Schiavazzi D, Elkins CJ, Eaton JK. Three-dimensional inspiratory flow in the upper and central human airways. Exp Fluids 56: 117, 2015. doi: 10.1007/s00348-015-1966-y. [DOI] [Google Scholar]
- 4.Boser SR, Park H, Perry SF, Ménache MG, Green FH. Fractal geometry of airway remodeling in human asthma. Am J Respir Crit Care Med 172: 817–823, 2005. doi: 10.1164/rccm.200411-1463OC. [DOI] [PubMed] [Google Scholar]
- 5.Boxt LM, Katz J, Liebovitch LS, Jones R, Esser PD, Reid L. Fractal analysis of pulmonary arteries: the fractal dimension is lower in pulmonary hypertension. J Thorac Imaging 9: 8–13, 1994. doi: 10.1097/00005382-199424000-00002. [DOI] [PubMed] [Google Scholar]
- 6.Comer JK, Kleinstreuer C, Zhang Z. Flow structures and particle deposition patterns in double-bifurcation airway models. Part 1. Air flow fields. J Fluid Mech 435: 25–54, 2001. doi: 10.1017/S0022112001003809. [DOI] [Google Scholar]
- 7.De Backer JW, Vos WG, Gorlé CD, Germonpré P, Partoens B, Wuyts FL, Parizel PM, De Backer W. Flow analyses in the lower airways: patient-specific model and boundary conditions. Med Eng Phys 30: 872–879, 2008. doi: 10.1016/j.medengphy.2007.11.002. [DOI] [PubMed] [Google Scholar]
- 8.De Backer JW, Vos WG, Vinchurkar SC, Claes R, Drollmann A, Wulfrank D, Parizel PM, Germonpré P, De Backer W. Validation of computational fluid dynamics in CT-based airway models with SPECT/CT. Radiology 257: 854–862, 2010. doi: 10.1148/radiol.10100322. [DOI] [PubMed] [Google Scholar]
- 9.de Rochefort L, Vial L, Fodil R, Maitre X, Louis B, Isabey D, Caillibotte G, Thiriet M, Bittoun J, Durand E, Sbirlea-Apiou G. In vitro validation of computational fluid dynamic simulation in human proximal airways with hyperpolarized 3He magnetic resonance phase-contrast velocimetry. J Appl Physiol 102: 2012–2023, 2007. doi: 10.1152/japplphysiol.01610.2005. [DOI] [PubMed] [Google Scholar]
- 10.de Vasconcelos TF, Sapoval B, Andrade JS Jr, Grotberg JB, Hu Y, Filoche M. Particle capture into the lung made simple? J Appl Physiol (1985) 110: 1664–1673, 2011. doi: 10.1152/japplphysiol.00866.2010. [DOI] [PubMed] [Google Scholar]
- 11.Elkins CJ, Alley M. Magnetic resonance velocimetry: applications of magnetic resonance imaging in the measurement of fluid motion. Exp Fluids 43: 823–858, 2007. doi: 10.1007/s00348-007-0383-2. [DOI] [Google Scholar]
- 12.Elkins CJ, Markl M, Pelc N, Eaton JK. 4D magnetic resonance velocimetry for mean velocity measurements in complex turbulent flows. Exp Fluids 34: 494–503, 2003. doi: 10.1007/s00348-003-0587-z. [DOI] [Google Scholar]
- 13.Florens M, Sapoval B, Filoche M. An anatomical and functional model of the human tracheobronchial tree. J Appl Physiol (1985) 110: 756–763, 2011. doi: 10.1152/japplphysiol.00984.2010. [DOI] [PubMed] [Google Scholar]
- 14.Fresconi FE, Prasad AK. Secondary velocity fields in the conducting airways of the human lung. J Biomech Eng 129: 722–732, 2007. doi: 10.1115/1.2768374. [DOI] [PubMed] [Google Scholar]
- 15.Glenny RW, Robertson HT. Determinants of pulmonary blood flow distribution. Compr Physiol 1: 39–59, 2011. doi: 10.1002/cphy.c090002. [DOI] [PubMed] [Google Scholar]
- 16.Goldberger AL, West BJ. Chaos and order in the human body. MD Comput 9: 25–34, 1992. [PubMed] [Google Scholar]
- 17.Große S, Schroder W, Klaas M, Klockner A, Roggenkamp J. Time resolved analysis of steady and oscillating flow in the upper human airways. Exp Fluids 42: 955–970, 2007. doi: 10.1007/s00348-007-0318-y. [DOI] [Google Scholar]
- 18.Grotberg JB. Pulmonary flow and transport phenomena. Annu Rev Fluid Mech 26: 529–571, 1994. doi: 10.1146/annurev.fl.26.010194.002525. [DOI] [Google Scholar]
- 19.Grotberg JB. Respiratory fluid mechanics and transport processes. Annu Rev Biomed Eng 3: 421–457, 2001. doi: 10.1146/annurev.bioeng.3.1.421. [DOI] [PubMed] [Google Scholar]
- 20.Hasegawa M, Nasuhara Y, Onodera Y, Makita H, Nagai K, Fuke S, Ito Y, Betsuyaku T, Nishimura M. Airflow limitation and airway dimensions in chronic obstructive pulmonary disease. Am J Respir Crit Care Med 173: 1309–1315, 2006. doi: 10.1164/rccm.200601-037OC. [DOI] [PubMed] [Google Scholar]
- 21.Hoffman EA, Clough AV, Christensen GE, Lin CL, McLennan G, Reinhardt JM, Simon BA, Sonka M, Tawhai MH, van Beek EJ, Wang G. The comprehensive imaging-based analysis of the lung: a forum for team science. Acad Radiol 11: 1370–1380, 2004. doi: 10.1016/j.acra.2004.09.005. [DOI] [PubMed] [Google Scholar]
- 22.Hoffman EA, Reinhardt JM, Sonka M, Simon BA, Guo J, Saba O, Chon D, Samrah S, Shikata H, Tschirren J, Palagyi K, Beck KC, McLennan G. Characterization of the interstitial lung diseases via density-based and texture-based analysis of computed tomography images of lung structure and function. Acad Radiol 10: 1104–1118, 2003. doi: 10.1016/S1076-6332(03)00330-1. [DOI] [PubMed] [Google Scholar]
- 22a.Horsfield K. Anatomical factors influencing gas mixing and distribution. Lung Biol Health Dis 25: 23–61, 1985. [Google Scholar]
- 23.Horsfield K, Cumming G. Angles of branching and diameters of branches in the human bronchial tree. Bull Math Biophys 29: 245–259, 1967. doi: 10.1007/BF02476898. [DOI] [PubMed] [Google Scholar]
- 24.Horsfield K, Cumming G. Morphology of the bronchial tree in man. J Appl Physiol 24: 373–383, 1968. doi: 10.1152/jappl.1968.24.3.373. [DOI] [PubMed] [Google Scholar]
- 25.Horsfield K, Dart G, Olson DE, Filley GF, Cumming G. Models of the human bronchial tree. J Appl Physiol 31: 207–217, 1971. doi: 10.1152/jappl.1971.31.2.207. [DOI] [PubMed] [Google Scholar]
- 26.Horsfield K, Thurlbeck A. Relation between diameter and flow in branches of the bronchial tree. Bull Math Biol 43: 681–691, 1981. doi: 10.1007/BF02458417. [DOI] [PubMed] [Google Scholar]
- 28.Isabey D, Chang HK. A model study of flow dynamics in human central airways. Part II: secondary flow velocities. Respir Physiol 49: 97–113, 1982. doi: 10.1016/0034-5687(82)90105-0. [DOI] [PubMed] [Google Scholar]
- 29.Jalal S, Nemes A, Van de Moortele T, Schmitter S, Coletti F. Three-dimensional inspiratory flow in a double bifurcation airway model. Exp Fluids 57: 148, 2016. doi: 10.1007/s00348-016-2234-5. [DOI] [Google Scholar]
- 30.Jan DL, Shapiro AH, Kamm RD. Some features of oscillatory flow in a model bifurcation. J Appl Physiol (1985) 67: 147–159, 1989. doi: 10.1152/jappl.1989.67.1.147. [DOI] [PubMed] [Google Scholar]
- 31.Kamiya A, Takahashi T. Quantitative assessments of morphological and functional properties of biological trees based on their fractal nature. J Appl Physiol (1985) 102: 2315–2323, 2007. doi: 10.1152/japplphysiol.00856.2006. [DOI] [PubMed] [Google Scholar]
- 32.Kamm RD. Airway wall mechanics. Annu Rev Biomed Eng 1: 47–72, 1999. doi: 10.1146/annurev.bioeng.1.1.47. [DOI] [PubMed] [Google Scholar]
- 33.Kassab GS. Scaling laws of vascular trees: of form and function. Am J Physiol Heart Circ Physiol 290: H894–H903, 2006. doi: 10.1152/ajpheart.00579.2005. [DOI] [PubMed] [Google Scholar]
- 34.Kim Y, Sinclair R, Chindapol N, Kaandorp JA, De Schutter E. Geometric theory predicts bifurcations in minimal wiring cost trees in biology are flat. PLoS Comput Biol 8: e1002474, 2012. doi: 10.1371/journal.pcbi.1002474. [DOI] [PMC free article] [PubMed] [Google Scholar]
- 35.Kitaoka H, Suki B. Branching design of the bronchial tree based on a diameter-flow relationship. J Appl Physiol (1985) 82: 968–976, 1997. doi: 10.1152/jappl.1997.82.3.968. [DOI] [PubMed] [Google Scholar]
- 36.Kitaoka H, Takaki R, Suki B. A three-dimensional model of the human airway tree. J Appl Physiol (1985) 87: 2207–2217, 1999. doi: 10.1152/jappl.1999.87.6.2207. [DOI] [PubMed] [Google Scholar]
- 37.Kleinstreuer C, Zhang Z. Airflow and particle transport in the human respiratory system. Annu Rev Fluid Mech 42: 301–334, 2010. doi: 10.1146/annurev-fluid-121108-145453. [DOI] [Google Scholar]
- 38.Kleinstreuer C, Zhang Z, Donohue JF. Targeted drug-aerosol delivery in the human respiratory system. Annu Rev Biomed Eng 10: 195–220, 2008. doi: 10.1146/annurev.bioeng.10.061807.160544. [DOI] [PubMed] [Google Scholar]
- 39.Kleinstreuer C, Zhang Z, Li Z. Modeling airflow and particle transport/deposition in pulmonary airways. Respir Physiol Neurobiol 163: 128–138, 2008. doi: 10.1016/j.resp.2008.07.002. [DOI] [PubMed] [Google Scholar]
- 40.Krause E, Bandt C, Schulz A, Schulz H. Fractal exponents for the upper airways of mammalian lungs. Comput Stat Data Anal 20: 583–590, 1995. doi: 10.1016/0167-9473(95)92763-N. [DOI] [Google Scholar]
- 41.Lambert AR, O’Shaughnessy P, Tawhai MH, Hoffman EA, Lin CL. Regional deposition of particles in an image-based airway model: large-eddy simulation and left-right lung ventilation asymmetry. Aerosol Sci Technol 45: 11–25, 2011. doi: 10.1080/02786826.2010.517578. [DOI] [PMC free article] [PubMed] [Google Scholar]
- 42.Lennon FE, Cianci GC, Cipriani NA, Hensing TA, Zhang HJ, Chen CT, Murgu SD, Vokes EE, Vannier MW, Salgia R. Lung cancer-a fractal viewpoint. Nat Rev Clin Oncol 12: 664–675, 2015. doi: 10.1038/nrclinonc.2015.108. [DOI] [PMC free article] [PubMed] [Google Scholar]
- 43.Lin CL, Tawhai MH, McLennan G, Hoffman EA. Characteristics of the turbulent laryngeal jet and its effect on airflow in the human intra-thoracic airways. Respir Physiol Neurobiol 157: 295–309, 2007. doi: 10.1016/j.resp.2007.02.006. [DOI] [PMC free article] [PubMed] [Google Scholar]
- 44.Ma B, Lutchen KR. CFD simulation of aerosol deposition in an anatomically based human large-medium airway model. Ann Biomed Eng 37: 271–285, 2009. doi: 10.1007/s10439-008-9620-y. [DOI] [PubMed] [Google Scholar]
- 45.Majumdar A, Alencar AM, Buldyrev SV, Hantos Z, Lutchen KR, Stanley HE, Suki B. Relating airway diameter distributions to regular branching asymmetry in the lung. Phys Rev Lett 95: 168101, 2005. doi: 10.1103/PhysRevLett.95.168101. [DOI] [PubMed] [Google Scholar]
- 46.Mandelbrot B. Fractals–a geometry of nature. New Sci 127: 38–43, 1990. [Google Scholar]
- 47.Mandelbrot B. The Fractal Geometry of Nature. New York: W. H. Freeman, 1983. [Google Scholar]
- 48.Markl M, Frydrychowicz A, Kozerke S, Hope M, Wieben O. 4D flow MRI. J Magn Reson Imaging 36: 1015–1036, 2012. doi: 10.1002/jmri.23632. [DOI] [PubMed] [Google Scholar]
- 49.Martonen TB, Yang Y, Hwang D, Fleming JS. Computer simulations of human lung structures for medical applications. Comput Biol Med 25: 431–446, 1995. doi: 10.1016/0010-4825(95)00027-2. [DOI] [PubMed] [Google Scholar]
- 50.Masters BR. Fractal analysis of the vascular tree in the human retina. Annu Rev Biomed Eng 6: 427–452, 2004. doi: 10.1146/annurev.bioeng.6.040803.140100. [DOI] [PubMed] [Google Scholar]
- 51.Mauroy B, Filoche M, Andrade JS Jr, Sapoval B. Interplay between geometry and flow distribution in an airway tree. Phys Rev Lett 90: 148101, 2003. doi: 10.1103/PhysRevLett.90.148101. [DOI] [PubMed] [Google Scholar]
- 52.Mauroy B, Filoche M, Weibel ER, Sapoval B. An optimal bronchial tree may be dangerous. Nature 427: 633–636, 2004. doi: 10.1038/nature02287. [DOI] [PubMed] [Google Scholar]
- 53.Miyawaki S, Hoffman EA, Lin CL. Effect of static vs. dynamic imaging on particle transport in CT-based numerical models of human central airways. J Aerosol Sci 100: 129–139, 2016. doi: 10.1016/j.jaerosci.2016.07.006. [DOI] [PMC free article] [PubMed] [Google Scholar]
- 54.Montaudon M, Desbarats P, Berger P, de Dietrich G, Marthan R, Laurent F. Assessment of bronchial wall thickness and lumen diameter in human adults using multi-detector computed tomography: comparison with theoretical models. J Anat 211: 579–588, 2007. doi: 10.1111/j.1469-7580.2007.00811.x. [DOI] [PMC free article] [PubMed] [Google Scholar]
- 55.Murray CD. The physiological principle of minimum work. I. The vascular system and the cost of blood volume. Proc Natl Acad Sci USA 12: 207–214, 1926. doi: 10.1073/pnas.12.3.207. [DOI] [PMC free article] [PubMed] [Google Scholar]
- 56.Nakano Y, Muro S, Sakai H, Hirai T, Chin K, Tsukino M, Nishimura K, Itoh H, Paré PD, Hogg JC, Mishima M. Computed tomographic measurements of airway dimensions and emphysema in smokers. Correlation with lung function. Am J Respir Crit Care Med 162: 1102–1108, 2000. doi: 10.1164/ajrccm.162.3.9907120. [DOI] [PubMed] [Google Scholar]
- 57.Nelson TR, Manchester DK. Modeling of lung morphogenesis using fractal geometries. IEEE Trans Med Imaging 7: 321–327, 1988. doi: 10.1109/42.14515. [DOI] [PubMed] [Google Scholar]
- 58.Nelson TR, West BJ, Goldberger AL. The fractal lung: universal and species-related scaling patterns. Experientia 46: 251–254, 1990. doi: 10.1007/BF01951755. [DOI] [PubMed] [Google Scholar]
- 59.Nowak N, Kakade PP, Annapragada AV. Computational fluid dynamics simulation of airflow and aerosol deposition in human lungs. Ann Biomed Eng 31: 374–390, 2003. doi: 10.1114/1.1560632. [DOI] [PubMed] [Google Scholar]
- 60.Pedley TJ. Pulmonary fluid dynamics. Annu Rev Fluid Mech 9: 229–274, 1977. doi: 10.1146/annurev.fl.09.010177.001305. [DOI] [Google Scholar]
- 61.Pelc NJ, Bernstein MA, Shimakawa A, Glover GH. Encoding strategies for three-direction phase-contrast MR imaging of flow. J Magn Reson Imaging 1: 405–413, 1991. doi: 10.1002/jmri.1880010404. [DOI] [PubMed] [Google Scholar]
- 62.Pelc NJ, Sommer FG, Li KC, Brosnan TJ, Herfkens RJ, Enzmann DR. Quantitative magnetic resonance flow imaging. Magn Reson Q 10: 125–147, 1994. [PubMed] [Google Scholar]
- 63.Phalen RF, Yeh HC, Schum GM, Raabe OG. Application of an idealized model to morphometry of the mammalian tracheobronchial tree. Anat Rec 190: 167–176, 1978. doi: 10.1002/ar.1091900202. [DOI] [PubMed] [Google Scholar]
- 64.Phillips CG, Kaye SR. Diameter-based analysis of the branching geometry of four mammalian bronchial trees. Respir Physiol 102: 303–316, 1995. doi: 10.1016/0034-5687(95)00056-9. [DOI] [PubMed] [Google Scholar]
- 65.Qian H, Bassingthwaighte JB. A class of flow bifurcation models with lognormal distribution and fractal dispersion. J Theor Biol 205: 261–268, 2000. doi: 10.1006/jtbi.2000.2060. [DOI] [PubMed] [Google Scholar]
- 66.Raabe OG, Yeh HC, Schum GM, Phalen R. Tracheobronchial Geometry: Human, Dog, Rat, Hamster–A Compilation of Selected Data from the Project Respiratory Tract Deposition Models. Washington, DC: U.S. Energy Research and Development Administration, Division of Biomedical and Environmental Research, 1976. [Google Scholar]
- 67.Regan EA, Hokanson JE, Murphy JR, Make B, Lynch DA, Beaty TH, Curran-Everett D, Silverman EK, Crapo JD. Genetic epidemiology of COPD (COPDGene) study design. COPD 7: 32–43, 2011. doi: 10.3109/15412550903499522. [DOI] [PMC free article] [PubMed] [Google Scholar]
- 68.Reynisson PJ, Scali M, Smistad E, Hofstad EF, Leira HO, Lindseth F, Nagelhus Hernes TA, Amundsen T, Sorger H, Langø T. Airway segmentation and centerline extraction from thoracic CT – comparison of a new method to state of the art commercialized methods. PLoS One 10: e0144282, 2015. doi: 10.1371/journal.pone.0144282. [DOI] [PMC free article] [PubMed] [Google Scholar]
- 69.Sauret V, Halson PM, Brown IW, Fleming JS, Bailey AG. Study of the three-dimensional geometry of the central conducting airways in man using computed tomographic (CT) images. J Anat 200: 123–134, 2002. doi: 10.1046/j.0021-8782.2001.00018.x. [DOI] [PMC free article] [PubMed] [Google Scholar]
- 70.Schroter RC, Sudlow MF. Flow patterns in models of the human bronchial airways. Respir Physiol 7: 341–355, 1969. doi: 10.1016/0034-5687(69)90018-8. [DOI] [PubMed] [Google Scholar]
- 71.Soodt T, Pott D, Klaas M, Schroder W. Analysis of basic flow regimes in a human airway model by stereo-scanning PIV. Exp Fluids 54: 1562, 2013. doi: 10.1007/s00348-013-1562-y. [DOI] [Google Scholar]
- 72.Suwa N, Takahashi T. Morphological and Morphometrical Analysis of Circulation in Hypertension and Ischemic Kidney. Munich, Germany: Urban & Schwarzenberg, 1971. [Google Scholar]
- 73.Tawhai MH, Hunter P, Tschirren J, Reinhardt J, McLennan G, Hoffman EA. CT-based geometry analysis and finite element models of the human and ovine bronchial tree. J Appl Physiol (1985) 97: 2310–2321, 2004. doi: 10.1152/japplphysiol.00520.2004. [DOI] [PubMed] [Google Scholar]
- 74.Tawhai MH, Lin CL. Airway gas flow. Compr Physiol 1: 1135–1157, 2011. doi: 10.1002/cphy.c100020. [DOI] [PubMed] [Google Scholar]
- 75.Thurlbeck A, Horsfield K. Branching angles in the bronchial tree related to order of branching. Respir Physiol 41: 173–181, 1980. doi: 10.1016/0034-5687(80)90050-X. [DOI] [PubMed] [Google Scholar]
- 76.Uylings HB. Optimization of diameters and bifurcation angles in lung and vascular tree structures. Bull Math Biol 39: 509–520, 1977. doi: 10.1007/BF02461198. [DOI] [PubMed] [Google Scholar]
- 77.van Ertbruggen C, Hirsch C, Paiva M. Anatomically based three-dimensional model of airways to simulate flow and particle transport using computational fluid dynamics. J Appl Physiol (1985) 98: 970–980, 2005. doi: 10.1152/japplphysiol.00795.2004. [DOI] [PubMed] [Google Scholar]
- 78.Wall WA, Rabczuk T. Fluid–structure interaction in lower airways of CT-based lung geometries. Int J Numer Methods Fluids 57: 653–675, 2008. doi: 10.1002/fld.1763. [DOI] [Google Scholar]
- 79.Washko GR, Diaz AA, Kim V, Barr RG, Dransfield MT, Schroeder J, Reilly JJ, Ramsdell JW, McKenzie A, Van Beek EJ, Lynch DA, Butler JP, Han MK. Computed tomographic measures of airway morphology in smokers and never-smoking normals. J Appl Physiol (1985) 116: 668–673, 2014. doi: 10.1152/japplphysiol.00004.2013. [DOI] [PMC free article] [PubMed] [Google Scholar]
- 80.Weibel ER. Fractal geometry: a design principle for living organisms. Am J Physiol Lung Cell Mol Physiol 261: L361–L369, 1991. doi: 10.1152/ajplung.1991.261.6.L361. [DOI] [PubMed] [Google Scholar]
- 81.Weibel ER. Principles and methods for the morphometric study of the lung and other organs. Lab Invest 12: 131–155, 1963. [PubMed] [Google Scholar]
- 82.Weibel ER. What makes a good lung? Swiss Med Wkly 139: 375–386, 2009. [DOI] [PubMed] [Google Scholar]
- 83.West BJ, Bhargava V, Goldberger AL. Beyond the principle of similitude: renormalization in the bronchial tree. J Appl Physiol (1985) 60: 1089–1097, 1986. doi: 10.1152/jappl.1986.60.3.1089. [DOI] [PubMed] [Google Scholar]
- 84.West GB, Brown JH, Enquist BJ. A general model for the origin of allometric scaling laws in biology. Science 276: 122–126, 1997. doi: 10.1126/science.276.5309.122. [DOI] [PubMed] [Google Scholar]
- 85.Wilson TA. Design of the bronchial tree. Nature 213: 668–669, 1967. doi: 10.1038/213668a0. [DOI] [PubMed] [Google Scholar]
- 86.Xia G, Tawhai MH, Hoffman EA, Lin CL. Airway wall stiffening increases peak wall shear stress: a fluid-structure interaction study in rigid and compliant airways. Ann Biomed Eng 38: 1836–1853, 2010. doi: 10.1007/s10439-010-9956-y. [DOI] [PMC free article] [PubMed] [Google Scholar]
- 87.Yin Y, Choi J, Hoffman EA, Tawhai MH, Lin CL. A multiscale MDCT image-based breathing lung model with time-varying regional ventilation. J Comput Phys 244: 168–192, 2013. doi: 10.1016/j.jcp.2012.12.007. [DOI] [PMC free article] [PubMed] [Google Scholar]
- 88.Yin Y, Choi J, Hoffman EA, Tawhai MH, Lin CL. Simulation of pulmonary air flow with a subject-specific boundary condition. J Biomech 43: 2159–2163, 2010. doi: 10.1016/j.jbiomech.2010.03.048. [DOI] [PMC free article] [PubMed] [Google Scholar]
- 89.Zhang Z, Kleinstreuer C. Transient airflow structures and particle transport in a sequentially branching lung airway model. Phys Fluids (1994) 14: 862–880, 2002. doi: 10.1063/1.1433495. [DOI] [Google Scholar]
- 90.Zhang Z, Kleinstreuer C, Hyun S. Size-change and deposition of conventional and composite cigarette smoke particles during inhalation in a subject-specific airway model. J Aerosol Sci 46: 34–52, 2012. doi: 10.1016/j.jaerosci.2011.12.002. [DOI] [Google Scholar]


