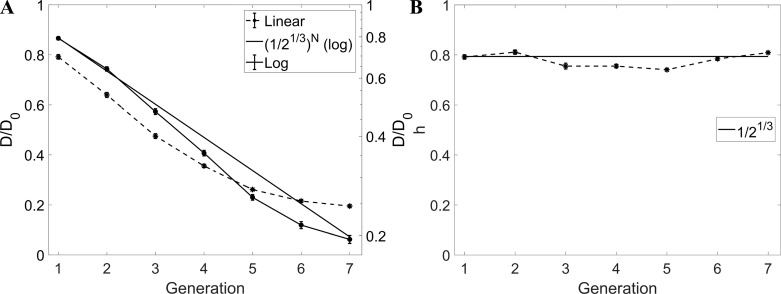
Fig. 8.
A: D/D0 vs. generation. B: homothety ratio (h) vs. generation. Error bars are reported in standard error. In A and B, the straight continuous line indicates the theoretical trend with h = 2−1/3. In A, D/D0 is plotted in both linear scale (dashed line, left axis) and logarithmic scale (continuous line, right axis).

