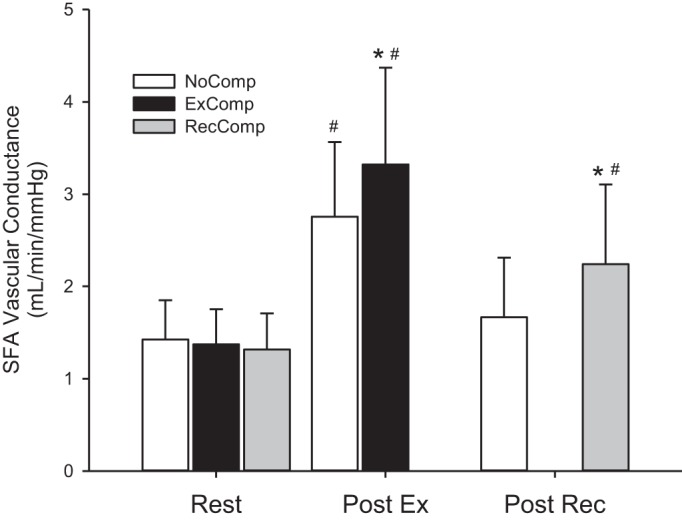
Fig. 3.

SFA vascular conductance values (mean ± SD) for the NoComp, ExComp, and RecComp conditions at rest, immediately following exercise (n = 11), and immediately following the cessation of compression during the postexercise recovery period (n = 10). #Values that are different from rest. *Significant difference from the NoComp condition.
