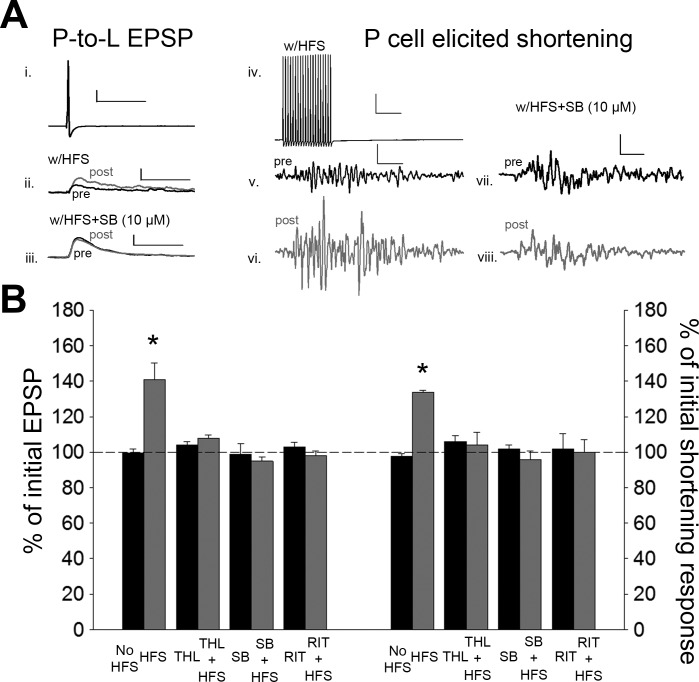
Fig. 4.
N-cell HFS elicits potentiation of the P-cell synapses and P-elicited shortening that are both 2-AG/TRPV dependent. A: sample recording of P-cell action potential (i; scale bar: 20.0 mV, 50 ms) and the EPSPs elicited before and after N-cell HFS (ii; scale bar: 2 mV, 50 ms) or HFS + SB (iii; scale bar same as ii) and sample recording of the train of P-cell action potentials used to elicit shortening (iv; scale bar: 20.0 mV, 50 ms) and the shortening responses following N-cell HFS (v and vi; scale bar: 2 mV, 50 ms) or N-cell HFS + SB (vii and viii; scale bar: 2.0 mV, 50 ms). Black and gray traces are pre- and posttest recordings, respectively. B: average ± SE changes in EPSP amplitude (left) and magnitude of the shortening response (right) in the no-stimulation control (No HFS), HFS, THL with no stimulation (THL), THL + HFS, SB with no stimulation (SB), SB + HFS, ritanserin with no stimulation (RIT), and RIT + HFS groups. *Statistically significant difference compared with controls based on a 1-way ANOVA with Student-Newman-Keuls post hoc test (see results). n = 5 for all treatment and control groups.

