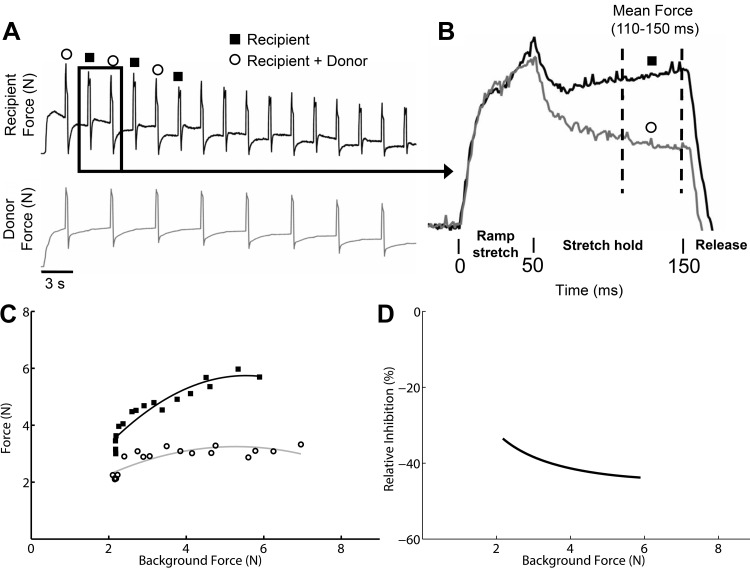
Fig. 1.
Experimental data and analysis [example from Fig. 6A, vastus muscle group (V) onto gastrocnemius (G)]. A: raw force profiles from the recipient and donor muscles collected over a range of background forces during a crossed extension reflex. B: example of 2 of the stretch-evoked force profiles illustrating the reduced force due to inhibitory feedback from the donor muscle. C: shown are the population of force responses from state 1 (solid black squares, recipient stretch only) and state 2 (open circles, recipient plus donor muscle stretch) plotted as a function of background forces and fit with a quadratic polynomial regression line (note that the end of the raw data from A is not shown to save space). D: shown is the difference between the state 1 and state 2 polynomial curves expressed as percent change from the state 1 curve.

