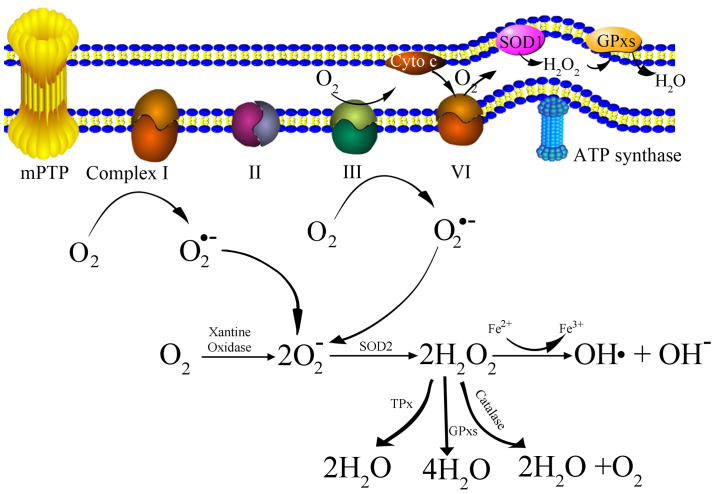
Figure 1.
Schematic representation of the generation of mtROS. Complex I, NADH dehydrogenase; II, succinate dehydrogenase; III, bc 1 complex; IV, cytochrome c oxidase; V, ATP synthase; Cyto c, cytochrome c; mPTP, mitochondrial permeability transition pore; SOD, superoxide dismutase; GPxs, glutathione peroxidase; TPx, thioredoxin peroxidase; mtROS, mitochondrial derived reactive oxygen species.

