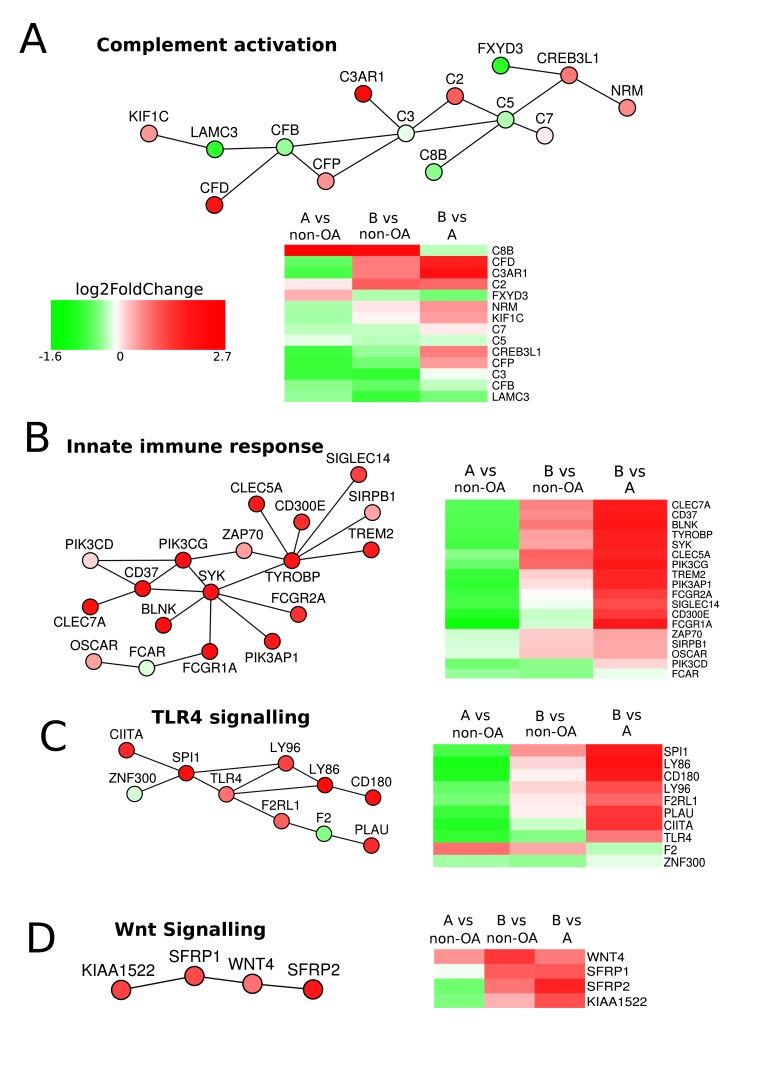
Figure 3.
PhenomeExpress analysis of OA Group A and Group B. Differential gene expression data between Group A (n=32) and Group B (n=26) were analysed with the PhenomeExpress algorithm to identify dysregulated subnetworks using known disease gene associations. Nodes are coloured by fold change. Heatmaps show the gene expression between Group A, Group B and non-OA for each subnetwork.

