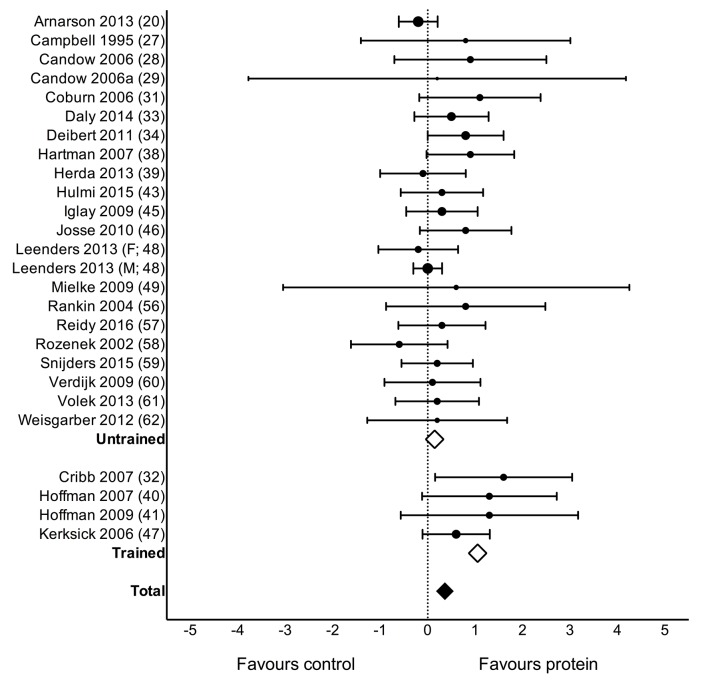
Figure 3.
Forest plot of the results from a random-effects meta-analysis shown as mean difference with 95% CIs on lean or fat-free mass (FFM; kg) in untrained and trained participants. For each study, the circle represents the mean difference of the intervention effect with the horizontal line intersecting it as the lower and upper limits of the 95% CI. The size of each circle represents the relative weight that study carried in the meta-analysis. The rhombi represent the weighted untrained, trained and total group’s mean difference. Total: 0.30 kg (0.09, 0.52) p=0.007, untrained: 0.15 kg (−0.02, 0.31), p=0.08 and trained: 1.05 kg (0.61, 1.50), p<0.0001.

