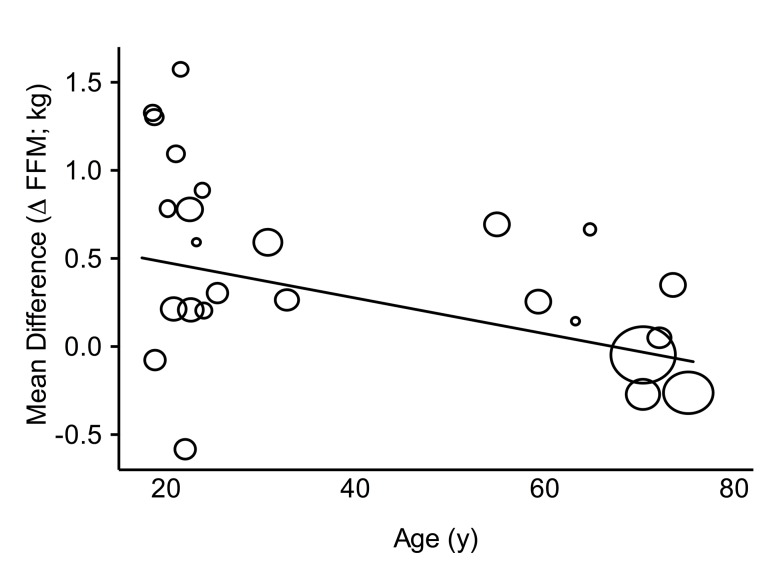
Figure 4.
Random-effects univariate meta-regression between age and the mean difference in fat-free mass (FFM) between groups. Each circle represents a study and the size of the circle reflects the influence of that study on the model (inversely proportionate to the SE of that study). The regression prediction is represented by the solid line (−0.01 kg (−0.02,–0.00), p=0.02).

