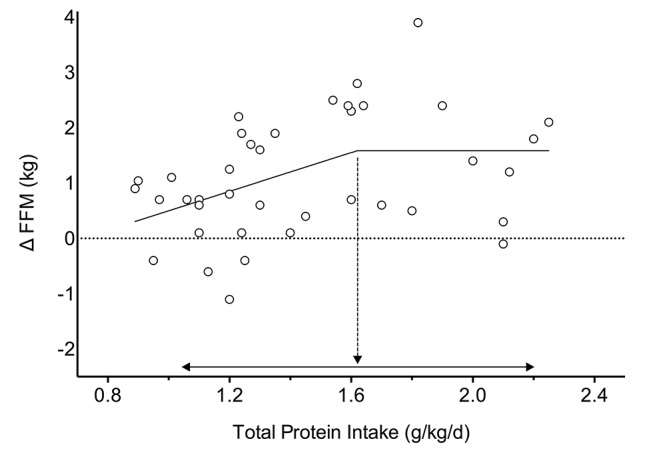
Figure 5.

Segmental linear regression between relative total protein intake (g/kg body mass/day) and the change in fat-free mass (ΔFFM) measured by dual energy X-ray absorptiometry. Each circle represents a single group from a study. Dashed arrow indicates the break point=1.62 g protein/kg/day, p=0.079. Solid arrow indicates 95% CI, (1.03 to 2.20).
