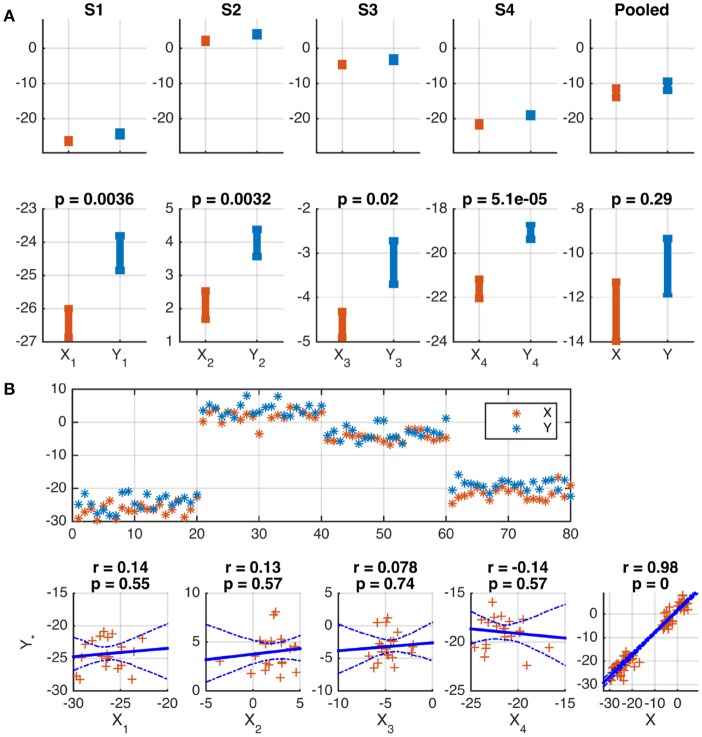
Figure 1.
Wrong conclusions when pooling data with nested structure for statistical testing. Samples were independently drawn for four subjects, s = 1, …, 4, and two variables, X and Y, according to , , where offsets μs were drawn independently for each subject from . (A) Depiction of the means and standard errors for each subject. A significant difference between means is correctly identified for each subject, but not for the pooled data of all subjects (see lower panels). This is because of the substantial between-subject variance (see upper panels). (B) Depiction of the data as a function of sample number (upper panel) and as scatter plots (lower panels). The common subject-specific offsets of X and Y cause strong significant correlation in the pooled data, which is not present in any individual subject, and may be considered spurious. 95% confidence intervals of the regression line obtained from 1,000 Bootstrap samples are marked by dashed blue curves.

