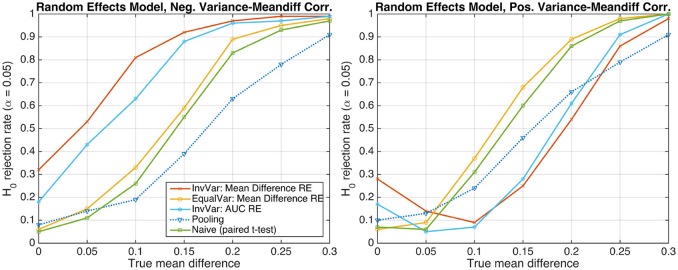
Figure 4.
The probability of rejecting the null hypothesis H0 : d = 0 as a function of the true mean difference d of Gaussian-distributed simulated data from S = 20 subjects. (Left) Data following a random-effects model and exhibiting a perfect negative correlation between the difference of the two group means and the standard deviation associated with this difference. (Right) Perfect positive correlation.

