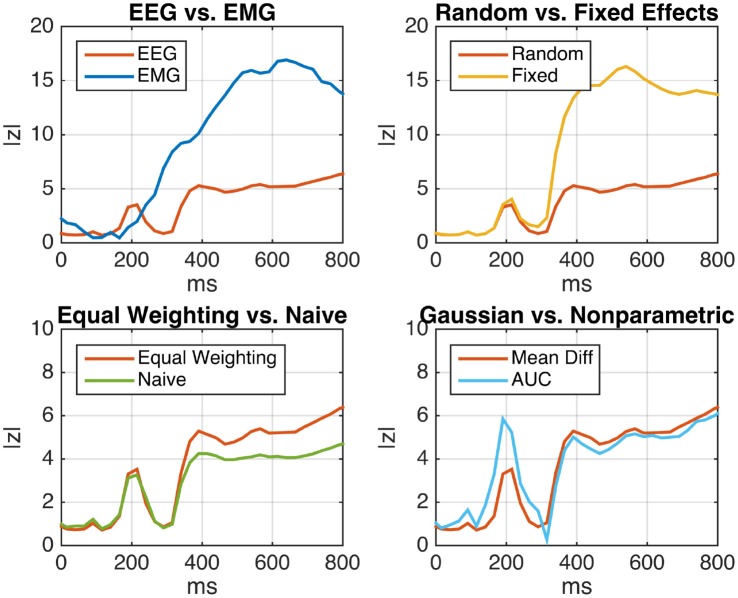
Figure 5.
Analysis of event-related EEG (neural) and EMG (muscular) activity of N = 18 car drivers during simulated emergency braking. Shown is the z-scaled difference between the mean activity during emergency braking situations and the mean activity during normal driving periods as a function of time after the emergency-initiating situation. (Top Left) Comparison of EEG and EMG under the random-effects (RE) model using two-sample subject level t-tests and equal weighting. EEG displays a significant class separation at an earlier time than EMG, reflecting the logical order of the underlying perceptual decision-making process. (Top Right) Comparison between the fixed-effect (FE) and RE models for EEG. The FE model displays inflated z-scores, indicating substantial but unaccounted between-subject variability. (Bottom Left) Comparison of the naive summary statistic approach and the sufficient-summary-statistic approach using equal weighting for EEG (RE model). By taking the subject-level variances into account, the sufficient-summary-statistic approach achieves a clearer separation. (Bottom Right) Comparison between the two-sample t-test and the non-parametric Wilcoxon-Mann-Whitney test for a group-level area under the ROC curve (AUC) greater than chance-level (RE model, equal weighting). Both tests lead to similar results, indicating that the distribution of samples is close to normal.

