
Table 2.
Clonotypes shared by the three brain lesions.
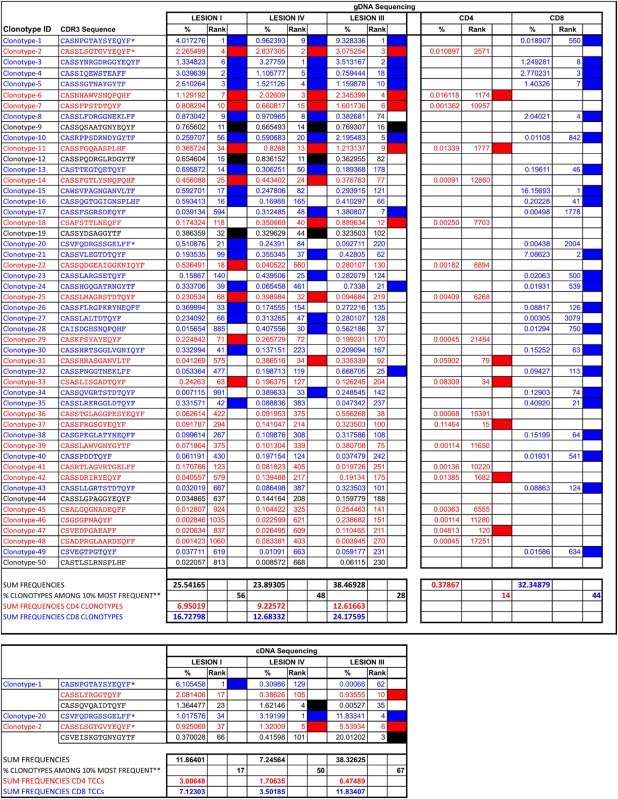 |
CD4+ clonotypes are depicted in red and CD8+ clonotypes in blue.
*Clonotypes identified in the three brain lesions using both gDNA and cDNA sequencing. %, frequency of each clonotype in each sample. Rank, position of the clonotype regarding its frequency compared with all clonotypes in the sample. Filled cells, clonotypes ranking among the 10% most frequent clonotypes in each sample.
**Frequency of the 50 clonotypes shared by the three lesions that are among the 10% most frequent clonotypes in each lesion.