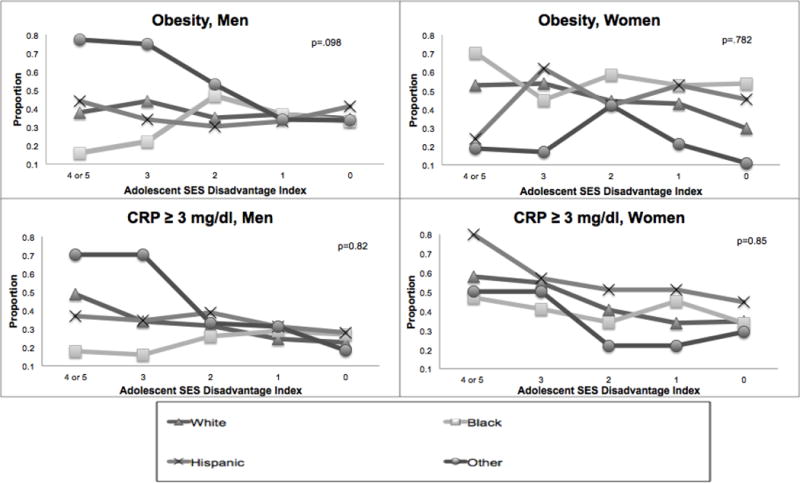
Figure 1.

Obesity and Inflammation Outcomes by Sex, Race, and SES
Note: Figure based on adjusted linear regression for each biomarker outcome with an interaction term for race/ethnicity and adolescent SES disadvantage. P-value derived from post-estimation Wald test for equality of coefficients for the interaction between race/ethnicity and SES for each model. For illustration purposes, the lines for each race/ethnicity category demonstrate the estimated prevalence of obesity or elevated CRP at each level of adolescent SES disadvantage, calculated separately for each gender.
Adolescent SES Disadvantage Index- ranges from 0 (no disadvantage) to 5 (most disadvantage).
Abbreviations: CRP, C-reactive protein; SES, Socioeconomic Status
