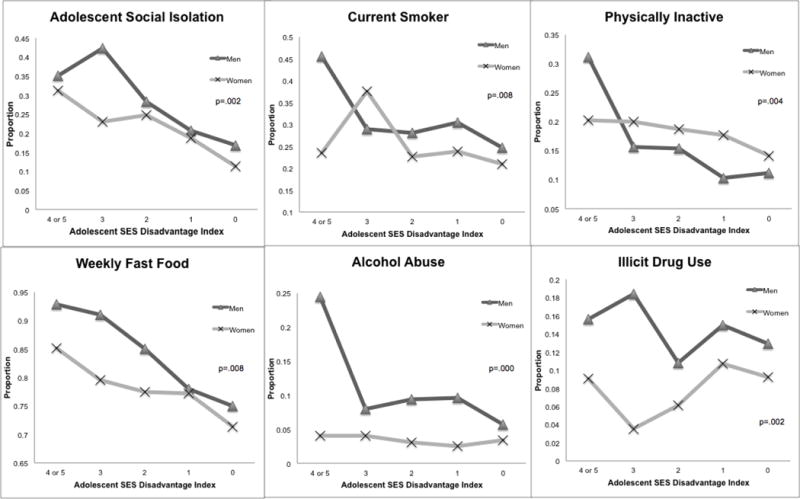
Figure 2.

Sex and SES Differentials in Risky Psychosocial and Health Behaviors
Note: Figure based on adjusted logistic regression for each psychosocial and health behavioral outcome with an interaction term for gender and adolescent SES disadvantage. P-value derived from post-estimation Wald test for equality of coefficients for the interaction between gender and SES for each model. For illustration purposes, the lines for each gender demonstrate the estimated population prevalence of each psychosocial and health behavior outcome at each level of adolescent SES disadvantage, averaged across all race/ethnic groups.
Adolescent SES Disadvantage Index- ranges from 0 (no disadvantage) to 5 (most disadvantage).
Abbreviations: SES, Socioeconomic Status
