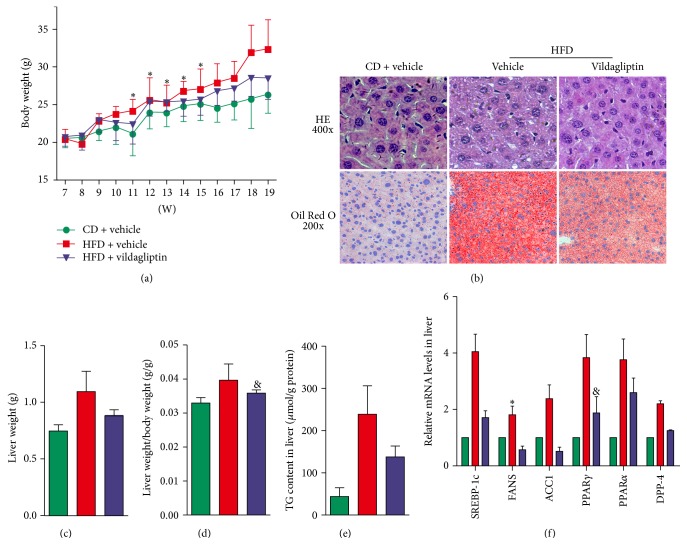
Figure 2.
Vildagliptin reduced hepatic lipid deposition. (a) Weights of the mice in the three groups during the experiment (n = 9 per group). (b) Liver tissue stained with H&E (upper panel, magnification ×400); liver tissue sections stained with Oil Red O (lower panel, magnification ×200). (c) Liver wet weights were measured (n = 7–9). (d) The liver index was calculated using liver wet weight/body weight (n = 7–9). (e) The triglyceride (TG) content in the liver was measured and normalized with the protein content (n = 7–9). (f) Relative mRNA levels of genes related to the synthesis of TG and dipeptidyl peptidase-4 (DDP-4). Expression values were normalized to β-actin mRNA. Data was presented as the means ± SD; ∗P < 0.05 relative to the CD group; &P < 0.05 relative to the HFD group.

