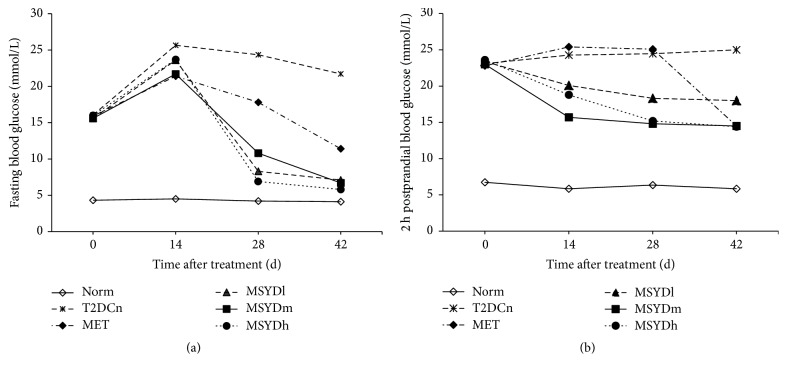
Figure 2.
Levels of fasting blood glucose and 2 h postprandial blood glucose. (a) The levels of fasting blood glucose. (b) The levels of 2 h postprandial blood glucose. Average levels of 10 subjects in each group are shown. Statistical significance was calculated with one-way ANOVA. Norm, normal control group; T2DCn, model control group; MET, metformin group; MSYDl, low-dose Modified Sanzi Yangqin Decoction group; MSYDm, medium-dose Modified Sanzi Yangqin Decoction group; MSYDh, high-dose Modified Sanzi Yangqin Decoction group.

