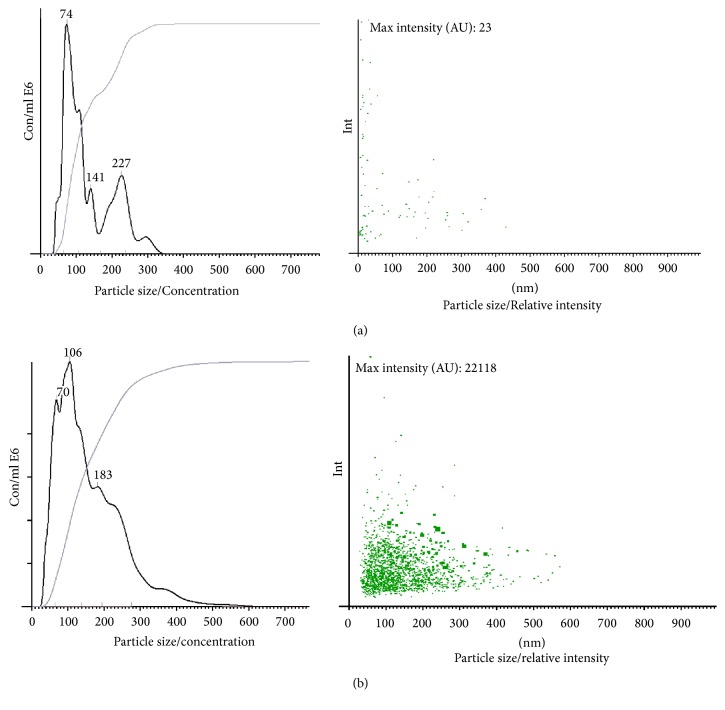
Figure 3.
Nanosight analysis (representative analysis). (a) NTA analysis of an HIV-negative urine sample had 0.4 × 10⁸ particles per ml (left panel) while (b) depicts an urine sample from a HIV+ patient that had 8.7 × 10⁸ particles per ml and has a greater relative intensity profile (right panel (a) and (b)) when compared to the HIV-negative sample. The Rank Sum T test showed that HIV+ patient urine samples had more particles per ml than the negative control urine (P < 0.05).

