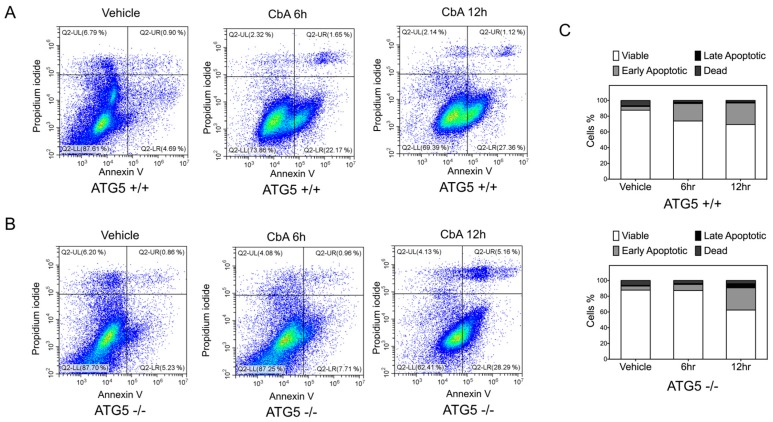
Figure 3.
Analysis of Annexin V and propidium iodide (PI) staining of ATG5+/+ and ATG5−/− cells following coibamide A treatment. (A) Wild-type and (B) ATG5-null mouse embryonic fibroblasts (MEFs) were labelled with annexin-V-FITC and PI to separate populations of viable (Lower Left quadrant: annexin V negative/PI negative), early apoptotic (Lower Right: annexin V positive/PI negative), late apoptotic (Upper Right: annexin V positive/PI positive) and dead/necrotic (Upper Left: annexin V negative/PI positive) cells using flow cytometry. Cells were treated with coibamide A (10 nM) or vehicle (0.1% DMSO) for up to 12 h before processing for FACS. Data was collected on a CytoFLEX Flow Cytometer using 1 µM staurosporine-treated cells as a positive control for induction of apoptosis. (C) Bar graph represents the percentage of viable, early-stage apoptotic, late-stage apoptotic and dead cells according to treatment. Figure is representative of comparisons made over 2–4 independent experiments.

