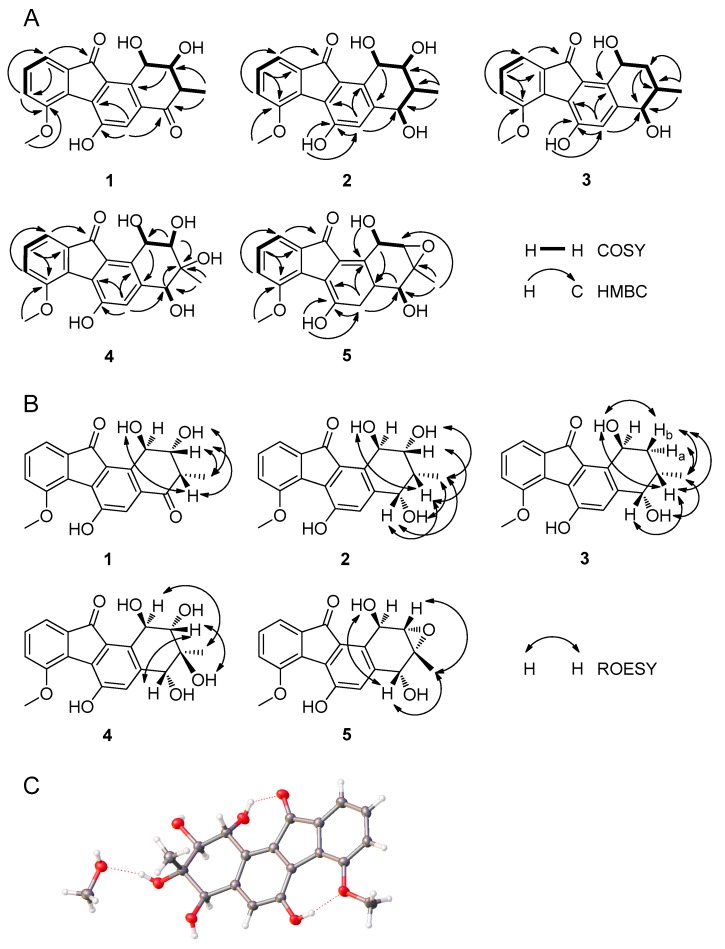
Figure 2.
The key COSY, HMBC and ROESY correlations of fluostatins M–Q (1–5) and the crystallographic structure of fluostatin P (4). (A) The key COSY and HMBC correlations of fluostatins M–Q (1–5). (B) The key ROESY correlations of fluostatins M–Q (1–5). (C) The crystallographic structure of fluostatin P (4).

