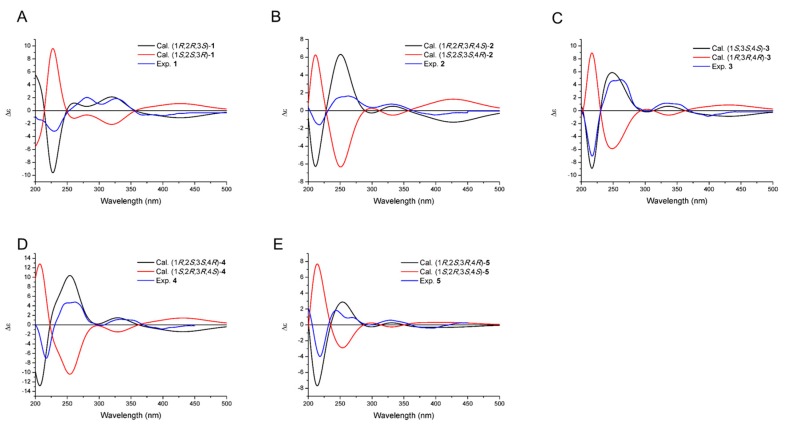
Figure 3.
The calculated and experimental electronic circular dichroism (ECD) spectra of fluostatins M–Q (1–5). (A) The ECD spectra of fluostatin M (1). (B) The ECD spectra of fluostatin N (2). (C) The ECD spectra of fluostatin O (3). (D) The ECD spectra of fluostatin P (4). (E) The ECD spectra of fluostatin Q (5).

